
Raiser’s Edge 7.94 Blog Series: Dashboards and Pivot Reports Changes
Published
Have you ever clicked on the Dashboards module and received the error, "Before you can use the Dashboard feature, you need to install Microsoft Office Web Components software."? Great news! We have updated the Dashboard technology from Office Web Components, so the installation of Office Web Components is no longer needed for Dashboards to work within The Raiser's Edge. Along with the replacement of the Office Web Components, we have also added an Auto-Update setting.
How will it look?
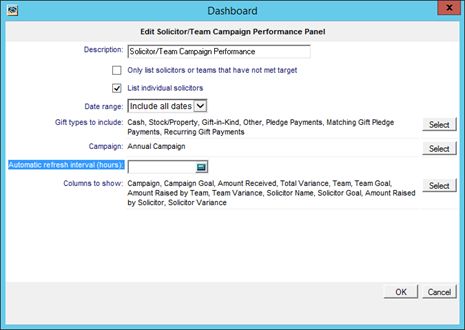
When adjusting your dashboard panel properties, you will see a field called “Automatic refresh interval (hours).”
How it will work?
The Auto-Update setting will allow users to enter an hourly interval in which the dashboard panel will automatically refresh. For example, if we enter “2” into the “Automatic refresh interval (hours) field on our dashboard panel properties window, the dashboard panel will refresh when you open it if the data is more than two hours old.
What can you do to prepare?
No action is needed.
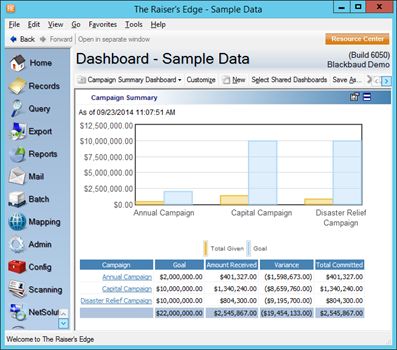
Outlook Web Components are replaced with Flot in RE 7.94
How will it look?
Along with our updated Dashboard features, we will also see important changes with Pivot Reports. Pivot Reports in 7.93 and lower use Office Web Application technology, which we are replacing. So, in 7.94, all Pivot Reports will be generated using Microsoft Excel.
How will it look?
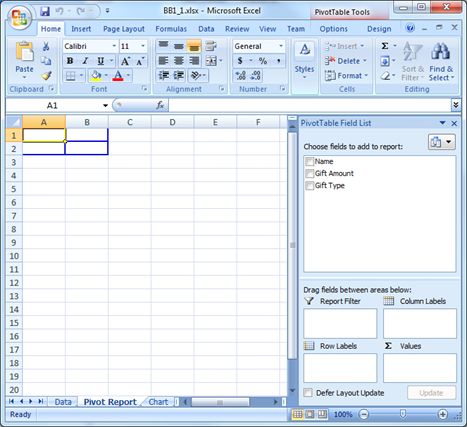
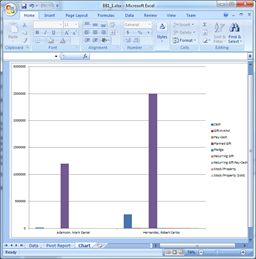
The Pivot Report parameter in “Reports” will look the same, but when you click Generate for the first time, Excel will open with 3 sheets- Data, Pivot Report, and Chart.
How will it work?
When users include their desired query into the Pivot Report and click Generate, Microsoft Excel will open with 3 separate sheets- a Data sheet, a Pivot Report sheet, and a Chart Sheet.
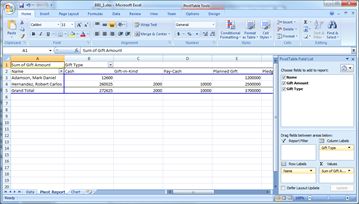
When users add fields on the right side (under “Choose fields to add to report”) and set column and row mappings, the data is pulled into the Pivot Report and Chart sheets automatically. If we save in Excel, the Pivot Report structure is saved so that users will not have to reassign columns and rows the next time the Pivot Report is generated.
What do you need to do to prepare?
We strongly recommend taking snapshots of your existing Pivot Report setups to use as a guide to recreate your new excel based pivots. Since Pivot Reports use Office Web Application technology, existing pivot report structure (row/column mappings, filters, etc.) will not remain or convert from 7.93 to 7.94.
Missed it? Read Blog 1 in our 7.94 series on Constituent Level Contact Information.
Dashboard Auto-Update
How will it look?
When adjusting your dashboard panel properties, you will see a field called “Automatic refresh interval (hours).”
How it will work?
The Auto-Update setting will allow users to enter an hourly interval in which the dashboard panel will automatically refresh. For example, if we enter “2” into the “Automatic refresh interval (hours) field on our dashboard panel properties window, the dashboard panel will refresh when you open it if the data is more than two hours old.
What can you do to prepare?
No action is needed.
New Dashboard Technology
Outlook Web Components are replaced with Flot in RE 7.94
How will it look?
Pivot Report Changes
Along with our updated Dashboard features, we will also see important changes with Pivot Reports. Pivot Reports in 7.93 and lower use Office Web Application technology, which we are replacing. So, in 7.94, all Pivot Reports will be generated using Microsoft Excel.
How will it look?
The Pivot Report parameter in “Reports” will look the same, but when you click Generate for the first time, Excel will open with 3 sheets- Data, Pivot Report, and Chart.
- The Data sheet will include the included query's results.
- The Pivot Report sheet will hold the Pivot Report.
- The Chart sheet will hold the chart associated with the generated Pivot Report.
How will it work?
When users include their desired query into the Pivot Report and click Generate, Microsoft Excel will open with 3 separate sheets- a Data sheet, a Pivot Report sheet, and a Chart Sheet.
When users add fields on the right side (under “Choose fields to add to report”) and set column and row mappings, the data is pulled into the Pivot Report and Chart sheets automatically. If we save in Excel, the Pivot Report structure is saved so that users will not have to reassign columns and rows the next time the Pivot Report is generated.
What do you need to do to prepare?
We strongly recommend taking snapshots of your existing Pivot Report setups to use as a guide to recreate your new excel based pivots. Since Pivot Reports use Office Web Application technology, existing pivot report structure (row/column mappings, filters, etc.) will not remain or convert from 7.93 to 7.94.
Missed it? Read Blog 1 in our 7.94 series on Constituent Level Contact Information.
News
Raiser's Edge® Blog
12/10/2014 6:00am EST
Leave a Comment
https://www.youtube.com/c/IrfanAfzal555?sub_confirmation=1
Pivots are such a time saving item that I recommend that EVERYONE should be proficient in creating and use pivot tables in Excel.