3 Hidden Gems In Altru Sales And Ticketing Reports!
Published
When it comes sales and ticketing reports we have our old standbys such as Daily Admission, Event Attendance, and Discount reports. It is also natural for us Altru veterans to instinctively gravitate to ad hoc queries as soon as we hear ticketing/sales and reports in one sentence. I also confess being guilty of this! However, there are some reports that are gems with a treasure trove of information. Here are three of my favorite often overlooked Sales Reports:
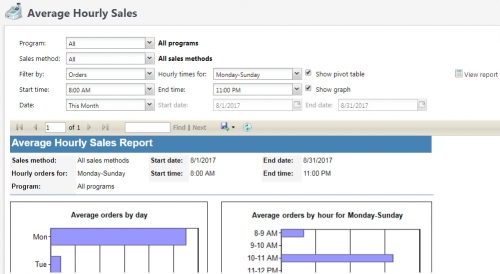
Average Hourly Sales Report
As the name implies the Average Hourly Sales report helps us target sales across hourly intervals. However, there are a number of features to this report that can help target very specific aspects of sales:
Ever curious as to how many online sales are you really getting off hours? This report makes it really easy! Just select Online Sales for the sales method, restrict your start and end times to after business hours. Remember: this is a sales report so it does not adjust for orders that have been refunded.
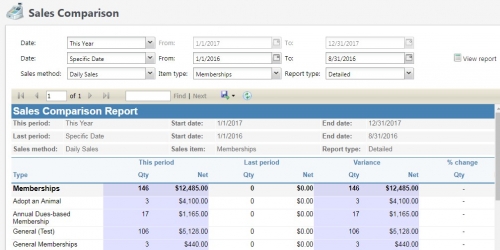
Sales Comparison Report
The Sales Comparison report shares an excellent birds eye view of comparing sales performance across a pair of time intervals that we can self-select. Similar to the Average Hourly Sales report, this comparison report also has a number of options that can help us target specific areas of interest:
Many of us keep track of how memberships are selling through points of contact such as daily sales and so, we can very easily adjust this report to compare how our front desk operations is faring this summer as opposed to last year. An efficient overview that is just a few clicks away!
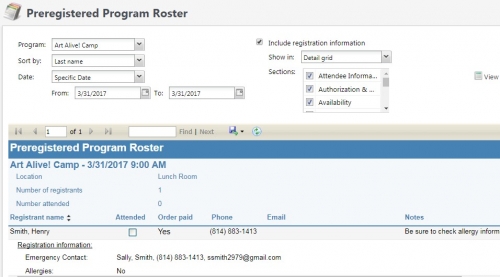
Preregistered Program Roster Report
The Preregistered Program Roster is a favorite of mine because it helps connect information we have organized in our Altru database to practical “non-digital” tasks we complete in day-to-day operations. This report is useful for team members who need a hard copy to review information as they are registering attendees to a preregistered program event. You may already be familiar with this report when it is delivered through the “View Roster” link within a specific preregistered program event. However, there are certain subtle but important differences in this report when we access it from the Sales or Analysis module.
This option of selecting date parameters and picking multiple programs delivers a one-stop shop for our team members to prepare rosters or research registrations for multiple events without having to hop across different individual programs and events in the Tickets module using the search module.
It is understandable that these reports may not have the exact set of parameters your organization uses for reporting purposes, however, they are really efficient in delivering primary information that can assist with analysis or operational tasks. One major advantage of reports in Altru is that they are very intuitive to use. As they are also efficient in terms of system resources, I would encourage your team to explore these and other reports over a period of time to see how they deliver different results and further assist in fine tuning your operations and support your mission.
Average Hourly Sales Report
As the name implies the Average Hourly Sales report helps us target sales across hourly intervals. However, there are a number of features to this report that can help target very specific aspects of sales:
- In this sales report we have a filter to differentiate between Orders and Tickets. The subtle difference being that sometimes sales orders can include multiple tickets within a common order. Also note that sometimes sales order can be more than just ticket purchases and may be just a membership purchase for example.
- In that same manner, it is easy for us to assume that this report is just for single ticketing, however this report can include (or exclude, as per our preference) online and group sales.
- While the default setting is for ‘All Programs’, you can focus on either a specific program or use the convenient “Selected Programs” option to target a specific set of programs via a query.
- Remember to take advantage of the start and end times of the day. This way you can narrow the report to the time intervals of interest and avoid empty columns or cells for weekends or off-hours.
- You can also target dates intervals to review sales across common interval options such day, week, month, quarter or year or a specific date interval if you prefer.
- This report delivers a couple of options to display results. You can choose to view a matrix of the results as a Pivot table and/or a visual display via bar graphs.

Ever curious as to how many online sales are you really getting off hours? This report makes it really easy! Just select Online Sales for the sales method, restrict your start and end times to after business hours. Remember: this is a sales report so it does not adjust for orders that have been refunded.
Sales Comparison Report
The Sales Comparison report shares an excellent birds eye view of comparing sales performance across a pair of time intervals that we can self-select. Similar to the Average Hourly Sales report, this comparison report also has a number of options that can help us target specific areas of interest:
- We have considerable options in identifying which are the two time intervals you want to compare. Apart from the conventional intervals of today, yesterday, week, month, quarter and year, we can also use the specific date option to customize the time interval to a specific period such as fiscal years. An added feature is that these time intervals are totally independent of each other, and so need not be of the same duration.
- We have the option of selecting which one of the sales methods we want to focus on: From staff-managed daily, advance and group sales, to your online channel, where constituents complete their transactions independent of staff assistance.
- The Item Type option in the report is where value is added because we can then target specific types of transactions such as admission tickets, memberships, donations or even resources.
- We also have the option of identifying if we would prefer an overview via a summary view or prefer to drill down into details. The detailed option for the report delivers the popular measures for the variety of transactions. So, for example, Admission Tickets are identified by programs, Memberships by membership programs, Donations by designations and Merchandise by merchandise departments. Resources are itemized by resource items which can be very useful to compare how resources are utilized part of group sales and facility rentals.
- The report delivers quantity sold and net revenue. In terms of direct comparison, the Variance section identifies differences in quantity while Percentage Change identifies these differences as percentages to help quantify variations.

Many of us keep track of how memberships are selling through points of contact such as daily sales and so, we can very easily adjust this report to compare how our front desk operations is faring this summer as opposed to last year. An efficient overview that is just a few clicks away!
Preregistered Program Roster Report
The Preregistered Program Roster is a favorite of mine because it helps connect information we have organized in our Altru database to practical “non-digital” tasks we complete in day-to-day operations. This report is useful for team members who need a hard copy to review information as they are registering attendees to a preregistered program event. You may already be familiar with this report when it is delivered through the “View Roster” link within a specific preregistered program event. However, there are certain subtle but important differences in this report when we access it from the Sales or Analysis module.
- Both of these reports, the one that is part of the program-event and the other that is deliver via the Sales or Analysis module, allow us to choose how we would like to display registration and related information sections. We have the option of displaying this information in either a single column or in separate rows with a “Detail Grid” view. This is particularly useful when registering attendees. If we need to confirm specific details of the information supplied by the attendee, we would opt for the “Detail Grid” view while the “Column” view would help the team member who uses this data as supplementary information.
- These reports also allow us to sort the list of registrants by first name or last name, so this list can be adjusted to preference of our team members.
- The difference between these two reports is that the overall report that is available through the Sales or the Analysis has the added functionality of identifying which program or programs we want to include in the report. When accessed through the preregistered program event page, this report is restricted to just that specific event, while the overall report allows us to select programs and dates of their occurrence delivering multiple event information in one report.

This option of selecting date parameters and picking multiple programs delivers a one-stop shop for our team members to prepare rosters or research registrations for multiple events without having to hop across different individual programs and events in the Tickets module using the search module.
It is understandable that these reports may not have the exact set of parameters your organization uses for reporting purposes, however, they are really efficient in delivering primary information that can assist with analysis or operational tasks. One major advantage of reports in Altru is that they are very intuitive to use. As they are also efficient in terms of system resources, I would encourage your team to explore these and other reports over a period of time to see how they deliver different results and further assist in fine tuning your operations and support your mission.
News
ARCHIVED | Blackbaud Altru® Tips and Tricks
08/16/2017 6:05am EDT


Leave a Comment