Query and Report Page Improvements - Coming Soon
Published
Did you know that over 30% of support cases have to do with Queries and Reports? They are two of the most used features in eTapestry, but getting familiar with them can be challenging. I remember when I first started working for eTapestry in January 2006 as a support analyst I had no idea what a Query even was, let alone what the terms Starting Criteria and Data Return Type meant. My background was in retail, rather than non-profits, so I had a lot to learn before I could effectively support the product. When I took my first phone call I prayed that it would be something like “How do I add an account?” or “How do I enter a pledge?”, but it wasn’t. Instead it was a question about a query that wasn’t pulling the right data. Within my first few phone calls I realized that this was a popular topic. For a couple of weeks I remember referencing the Help Topic on Data Return Types during a lot of calls, until it all finally clicked and queries were no longer a mystery. When I began teaching classes on how to build Queries in eTapestry, I found it was helpful to tell users which settings to focus on and which could be ignored because most of the time our default setting was correct.
Some of my Query tips include:
Over the next few months we’ll be making changes to the Query and Report pages to make them easier to understand and use. One of the first changes will be to the layout of the Query and Report pages. We are giving them a structure that is laid out in the order that users perform the tasks, has tasks grouped logically, and provides more explanatory text.
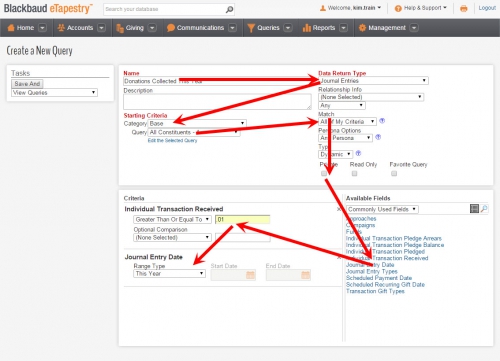
Here’s a screenshot of the Query page today and the red arrows point out the less than ideal workflow people follow when building Queries:

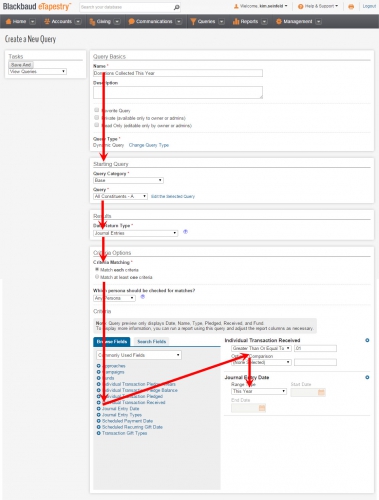
Now here’s a screenshot of the new Query page and the red arrows point out the simplified workflow:

I hope this sneak preview makes you excited, it definitely makes me excited! Our User Experience Designers have spent a lot time talking to customers to get feedback on ways we could make our Queries and Reports easier and this first change is only the beginning. The new Query and Report pages are currently scheduled to be released on September 27, 2015. Stay tuned for more information on other enhancements coming later this year and in early 2016.
Some of my Query tips include:
- Name your queries thoughtfully, it makes it easier to remember their function later.
- 95% of the time your Data Return Type should be set to Accounts or Journal Entries. If you track couples in households then you may also use Head of Household Accounts.
- 95% of the time your Starting Criteria should be set to Base: All Constituents.
- Decide whether you want to Match All or Any of your criteria (most of the time users want All).
- Leave the rest of the settings in the top section alone.
Over the next few months we’ll be making changes to the Query and Report pages to make them easier to understand and use. One of the first changes will be to the layout of the Query and Report pages. We are giving them a structure that is laid out in the order that users perform the tasks, has tasks grouped logically, and provides more explanatory text.
Here’s a screenshot of the Query page today and the red arrows point out the less than ideal workflow people follow when building Queries:

Now here’s a screenshot of the new Query page and the red arrows point out the simplified workflow:

I hope this sneak preview makes you excited, it definitely makes me excited! Our User Experience Designers have spent a lot time talking to customers to get feedback on ways we could make our Queries and Reports easier and this first change is only the beginning. The new Query and Report pages are currently scheduled to be released on September 27, 2015. Stay tuned for more information on other enhancements coming later this year and in early 2016.
News
ARCHIVED | Blackbaud eTapestry® Tips and Tricks
08/31/2015 10:07am EDT

Leave a Comment