
Visual Chart Organizer in Financial Edge
Published
Can you quickly produce a financial statement for a funder with the specific expense categories they require? Can you run a report to double-check the figures on your organization’s audit? How about reports to help prepare Form 990 or Census Bureau reports? If you can’t produce these reports quickly without resorting to exporting to Excel, you are missing the power of the Visual Chart Organizer (VCO).
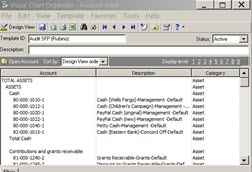
VCO’s allow you to create custom charts of accounts to meet the groupings and level of detail desired by each audience. Once the VCO is set up, running any of these specialized reports is as easy as selecting the desired visual chart organizer.
For example, one funder may want to see a heading called “Personnel Costs” which is a roll-up of multiple accounts such as salaries, payroll taxes, employee insurance, and other fringe benefits. Conversely, another funder my want to see one heading for “Salaries” and another for “Fringe Benefits”: in this case, the same accounts are grouped together in a different way.
VCO’s take a bit of time to set up, but once set up is complete, the time investment will repaid many times over when you are able to produce audience-specific reports in a flash!
(Community Manager's Note: This is a blog entry in our Summer School Contest. It has not been vetted by the Financial Edge team for accuracy.)
News
Organizational Best Practices Blog
07/24/2017 1:24pm EDT
Leave a Comment