Create Giving Day Dashboards In RENXT
Published
Create dashboards to share data from Blackbaud Peer to Peer Fundraising, powered by JustGiving on giving day. Shared access to dashboards in RENXT can give those involved in giving day insight into fundraising performance and help make key decisions on giving day.
A very important element for giving days is to be able to keep an eye on the data. To send out updates to alumni, keep your leadership informed, it will be vital to have data available readily available. When using the RENXT JustGiving Integration data becomes accessible to all in your organization. Consider using Web View Report Builder as a way to share real-time insight and progress on giving day (and for other peer-to-peer fundraising efforts.) In Web View navigate to Analysis>Report Builder. Here you will find a blank canvas to begin building your report. Here are two ways you could be using Web View Report Builder for giving day.
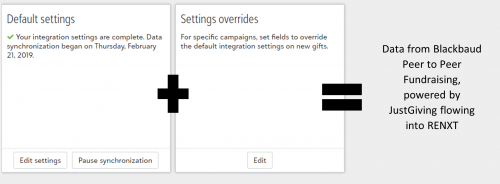
A quick reminder that the RENXT JustGiving Integration requires both Default settings and Settings overrides. Once set, data will flow from Blackbaud Peer to Peer Fundraising, powered by JustGiving into RENXT.

Example 1: Custom Report built by Fund
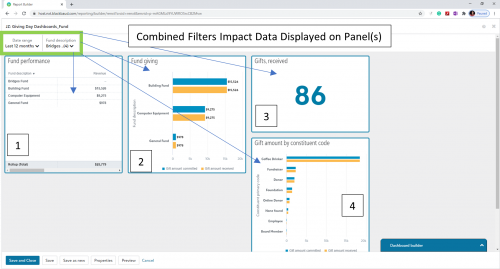
This example will be especially pertinent if each JustGiving Campaign will have its own Fund in RENXT. Perhaps on giving day you have four projects where you will build four JustGiving Campaigns, with four unique Funds in RENXT. In this case, you will most likely want to know how each Fund is performing and totals for giving day. Notice at the top left corner, in the green box, are the filters. In this instance, Date Range and Fund Description are chosen. The Fund Description filter is narrowed so that the data in the report only shows the Funds that correspond with giving day and corresponding with the JustGiving Campaigns.

Here is a breakdown of the panels on this custom report and why they are helpful.
Panel 1: Fund performance
This panel shows revenue from each Fund (and therefore each JustGiving Campaign.) And contains a Rollup (Total) for all the Funds selected in the filter. Chosen for the quick view of dollars raised in each Fund and totals.
Panel 2: Fund giving
This panel show gift amount committed versus gift amount received. Chosen for the visual view of Funds and gives an idea of funds to be expected versus paid.
Panel 3: Gifts, received
This panel shows the number of gifts within the date range and given to the Funds choose in the filters. While this shows the number of gifts, this number will also be close to the number of constituents donating to giving day.
Panel 4: Gift amount by constituent code
The panel shows the constituent codes associated with the gifts to the selected Funds. Depending upon your constituent code structure, this could be helpful to see the types of constituents engaging in giving day. For instance knowing that “Alumni” and “Current Parents” make up $xx,xxx of giving day gifts is valuable insight.
Example 2: Custom Report by Appeal
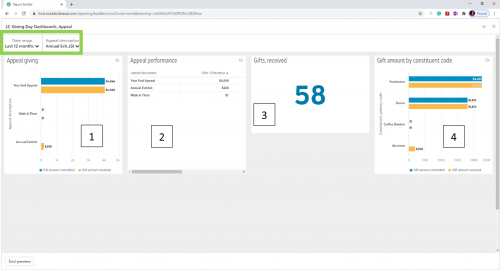
In this example, each JustGiving Campaign will have its own Appeal in RENXT. On giving day you might trying to raise money for three projects. So, you will build three JustGiving Campaigns which will each have their own Appeal. Again, you will likely want to know how each Appeal is performing individually and in total. The filter for this custom report is Appeal description and Date range. The Appeal description has only the Appeals that pertain to giving day selected.

Here is a breakdown of the panels on the Appeal custom report and why they are helpful.
Panel 1: Appeal giving
This panel shows giving to each Appeal, or, in this case each JustGiving Campaign. You can see how each Appeal is performing in comparison to the other Appeals.
Panel 2: Appeal performance
This panel shows the dollars received from each Appeal selected in the Appeal filter. Useful for a quick comparison.
Panel 3: Gifts, received
The number of gifts received based on the filters. This is a count of donations, not a count of constituents. The count can give you an idea of how many gifts are given in comparison to the goal for giving day.
Panel 4: Gift amount by constituent code
This panel shows the constituent code associated with the gift. It can help determine which groups of your supports are most active in giving day.
Depending on how your organization uses the Campaign, Fund, Appeal structure, your Reports will have some variation from the example reports. The custom reports will also show all gifts to giving day, not just those received from JustGiving. Additionally, because there is no filter set for “gift status” even those gifts not yet entered (committed) to the database should show in these reports in real time.
One last tip to share, perhaps the most important: consistency is essential. Data can be sliced, diced, divided in infinite ways. The more consistently you build your reports, the easier it will be to make data driven decisions. This maximum holds true with all reporting, but especially on giving day when there are likely many eyes monitoring fundraising success.
A quick reminder that the RENXT JustGiving Integration requires both Default settings and Settings overrides. Once set, data will flow from Blackbaud Peer to Peer Fundraising, powered by JustGiving into RENXT.

Example 1: Custom Report built by Fund
This example will be especially pertinent if each JustGiving Campaign will have its own Fund in RENXT. Perhaps on giving day you have four projects where you will build four JustGiving Campaigns, with four unique Funds in RENXT. In this case, you will most likely want to know how each Fund is performing and totals for giving day. Notice at the top left corner, in the green box, are the filters. In this instance, Date Range and Fund Description are chosen. The Fund Description filter is narrowed so that the data in the report only shows the Funds that correspond with giving day and corresponding with the JustGiving Campaigns.

Here is a breakdown of the panels on this custom report and why they are helpful.
Panel 1: Fund performance
This panel shows revenue from each Fund (and therefore each JustGiving Campaign.) And contains a Rollup (Total) for all the Funds selected in the filter. Chosen for the quick view of dollars raised in each Fund and totals.
Panel 2: Fund giving
This panel show gift amount committed versus gift amount received. Chosen for the visual view of Funds and gives an idea of funds to be expected versus paid.
Panel 3: Gifts, received
This panel shows the number of gifts within the date range and given to the Funds choose in the filters. While this shows the number of gifts, this number will also be close to the number of constituents donating to giving day.
Panel 4: Gift amount by constituent code
The panel shows the constituent codes associated with the gifts to the selected Funds. Depending upon your constituent code structure, this could be helpful to see the types of constituents engaging in giving day. For instance knowing that “Alumni” and “Current Parents” make up $xx,xxx of giving day gifts is valuable insight.
Example 2: Custom Report by Appeal
In this example, each JustGiving Campaign will have its own Appeal in RENXT. On giving day you might trying to raise money for three projects. So, you will build three JustGiving Campaigns which will each have their own Appeal. Again, you will likely want to know how each Appeal is performing individually and in total. The filter for this custom report is Appeal description and Date range. The Appeal description has only the Appeals that pertain to giving day selected.

Here is a breakdown of the panels on the Appeal custom report and why they are helpful.
Panel 1: Appeal giving
This panel shows giving to each Appeal, or, in this case each JustGiving Campaign. You can see how each Appeal is performing in comparison to the other Appeals.
Panel 2: Appeal performance
This panel shows the dollars received from each Appeal selected in the Appeal filter. Useful for a quick comparison.
Panel 3: Gifts, received
The number of gifts received based on the filters. This is a count of donations, not a count of constituents. The count can give you an idea of how many gifts are given in comparison to the goal for giving day.
Panel 4: Gift amount by constituent code
This panel shows the constituent code associated with the gift. It can help determine which groups of your supports are most active in giving day.
Depending on how your organization uses the Campaign, Fund, Appeal structure, your Reports will have some variation from the example reports. The custom reports will also show all gifts to giving day, not just those received from JustGiving. Additionally, because there is no filter set for “gift status” even those gifts not yet entered (committed) to the database should show in these reports in real time.
One last tip to share, perhaps the most important: consistency is essential. Data can be sliced, diced, divided in infinite ways. The more consistently you build your reports, the easier it will be to make data driven decisions. This maximum holds true with all reporting, but especially on giving day when there are likely many eyes monitoring fundraising success.
News
ARCHIVED | JustGiving® from Blackbaud® Tips and Tricks
03/15/2021 10:07pm EDT


Leave a Comment