This week, the
SKY Reporting early adopter program introduced a couple new features to ease comparison of measures – against other measures or their previous selves — with
Insight Designer.
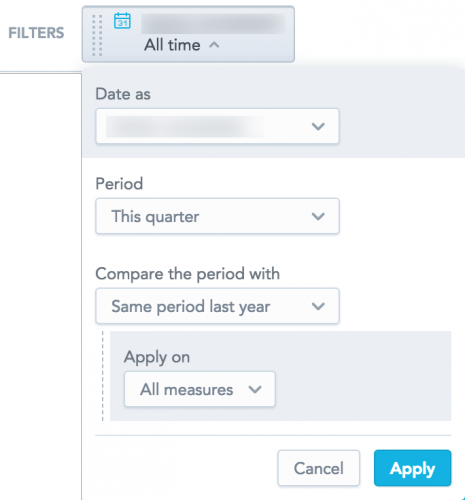 Compare an insight's measures' time-over-time performance.
 When you design a table, column or bar chart, line chart, or headline in
Insight Designer, you can now compare its measures' performance time-over-time, such as to the same period the previous year. To compare an insight's measures time-over-time, add a
Date attribute filter and then choose the period to compare — such as Same period last year — and which measures to apply it to.
A few things to note:
- When you apply time-over-time analysis, the comparison measures automatically appear above each corresponding measure under Measures, with "- SP year ago" appended to their names. You can sort, rename, and adjust the measures as necessary.
- If you apply the filter to All measures, the time-over-time comparison automatically applies to any new measures added to the insight.
- The time-over-time comparison doesn't apply to any measures that already include a date filter.
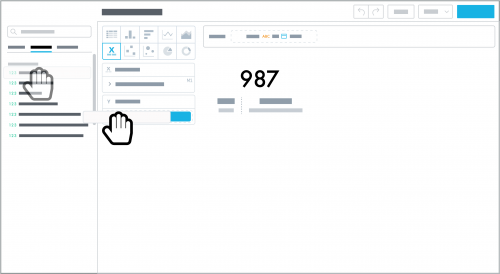 Compare two measures with a headline insight.
 With
Insight Designer, you can design a headline insight to summarize a measure's amount at-a-glance, similar to a key performance indicator (KPI). To compare a headline measure to another measure, such as for year-over-year analysis or to gauge two related totals, you can now include a secondary measure for comparison. When you add a secondary measure, you can view its amount and the percentage difference between it and the primary measure.