Chances are your technology infrastructure includes a lot of data sources (that may or may not be interconnected) that inform your organization's strategic decision-making and reporting. Investing in training, data hygiene, and automating some of your organization’s standard reporting can vastly improve efficiency, transforming your data into true business intelligence that gives your team insights to use in better fulfilling fundraising and mission goals.As a functional expert at Blackbaud, I speak to organizations across the globe about their operational challenges. When it comes to reporting, quite a few of you have told me that silos, double work, and redundant, meaningless reporting can turn daily business operations into a circus. A circus, that sounds like fun, right? Not when it's you, working alone to juggle multiple departmental reports, audit report preparation, and board/trustee updates. That can make the best of us feel like part of a rather precarious trapeze act.
It doesn't have to be this way. It’s time to consider how intelligent the “I” is in your organization’s business intelligence reports. Your back office can be better connected and save time by not producing duplicate or hollow reports. SKY API cloud architecture and Microsoft Power Platform allow you to treat complex, separate systems like sources of multidimensional data.
What is business intelligence? "Business intelligence (BI) uncovers insights for making strategic decisions. Business intelligence tools analyze historical and current data and present findings in intuitive visual formats." (
Microsoft, 2025)
Here are a few ways your team can start transforming your current reports and building connected, compelling cases for intentional, proactive execution.
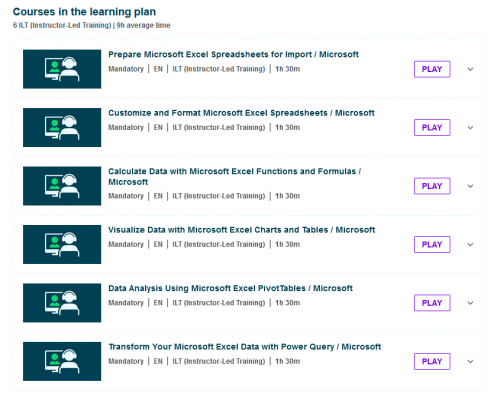
- Get down to the basics. The first step in generating business intelligence is collecting and transforming data. If you're just getting started, learning how to clean up, transform, and visualize data using Microsoft Excel could be just what you need. Check out the Microsoft Excel Learning Path from Blackbaud University (Learn subscription required). You'll build confidence as a data whiz when you can execute charts and pivot tables, even speed up cleanup and transformation of your data with Power Query.
- Evaluate current table values. How long has your organization used its campaign, fund, and appeal structure? Do you use packages, gift attributes, gift or source codes? Are your constituent codes doubling as prospect classifications, appeal segments, or education information? Does your current structure make sense? Flexibility is one matchless value of Blackbaud Raiser's Edge NXT® but keep your staff from bending over backward and get back on the same data entry page. Eliminate misplaced, inaccurate, or obsolete values from your Configuration tables. Take a step back and review, Payment Processing and The Journey of a Donated Dollar.
- Review current reports. It’s time to reevaluate the who, what, and how. Who is the audience for a report? What insights and metrics are significant? How timely does the report need to be, daily, weekly, or monthly? Will the report be accessed and delivered as a standalone dashboard, email, or Teams post? The Reporting Tips to be a Visionary Finance Leader infographic can provide some helpful tips on building reports that fuel strategy and action.
- Move to dedicated BI tools. High powered BI tools like Microsoft Power BI and Tableau can help you create the visualizations and analyses you've only been dreaming of to this point. The Blackbaud Marketplace lists data warehouse applications (search on "business intelligence") that can help you collect data from all your independent systems for analysis with a tool like Power BI. If you have the technical skills, you can also use SKY APIs to create your own business intelligence solutions. You don’t have to go it alone, either. A Power BI user group made up of Blackbaud customers, meets monthly to share examples and support each other in progressing forward.
- Make training a priority. Continue to learn each solution in your organization's ecosystem. Recently, Blackbaud announced Six Waves of Innovation and hosted Product Update Briefings. The industry-leading software you use daily is changing rapidly, incorporating cutting-edge technology to modernize your work. I recommend you start with these two Blackbaud University courses: Query in Web View and Power Platform Overview.
Your organization does phenomenal work supporting, funding, and uplifting countless communities. A new perspective on managing the complex data sets in your Blackbaud solutions like Raiser’s Edge NXT®, Financial Edge NXT® and Merchant Services™ can be a great start to modernizing your mission delivery. Your data is just the beginning of expanding your impact in the world. Kick the year off right by returning to the basics of Business Intelligence.