Tom this is great. But what report type is the bottom-left tile, title beginning ‘MU-Funded Opportunities…’?
Ahh, that's a heatmap Insight. Essentially a kind of crosstab / pivot table report that allows you to show the intersection of two different data points and then it highlights (darker color) the higher numbers.
In this case it's counting the number of funded proposals by each fundraiser (x axis) within certain categories (y axis)…
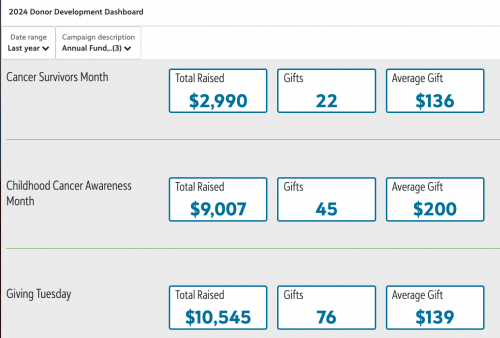
@Gemma Atkinson I wish there were more examples on here - I just hopped on to search for exactly this topic!My favorite thing I've done recently is to break down some detail on our appeals from last year. Though I wish I could filter the insights based on things like “new donors." Hopefully there will continue to be development on this feature.