Take Your Event Reporting To The Next Level
Published
Phil, the groundhog, may have seen his shadow a few weeks ago indicating that we have 6 more weeks of winter on the horizon, but in my mind the beginning of March signifies we are quickly approaching Spring. Flowers are starting to bloom, the weather is slowly making a turn toward warmer temperatures and Organizations are ramping up for their busiest season with Special Events to take place over the course of the Spring and Summer. Are you planning a Spring Golf tournament, maybe a Summer Gala, a Spring Fling?
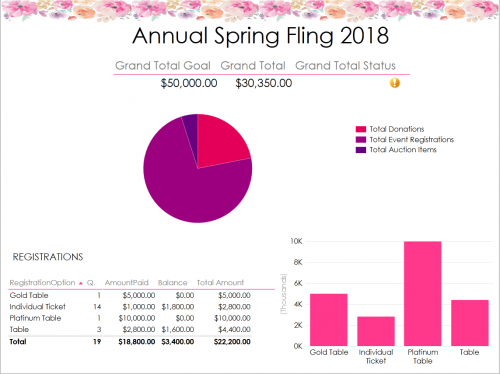
While you're dusting off your event reporting, you may be wondering how to account for donations, auction items, and registrations all in one report. While Altru does not have a canned report to show you all of these items at once, we can build a customized OData Dashboard to help you keep track of your event fundraising progress. Not only will OData help to track all of this revenue in one place, it also allows you to create an end report that is easy for your Executive Team and Board Members to view and digest without overwhelming them with multiple queries. Check out the example below!
While building this dashboard may seem overwhelming, we can easily break this process down into a few easy steps:
Before we can get started with building our reporting using OData, we will first need to create 4 queries in Altru. The first query, will be a list of registrants with registration options. Next, we will want to create a query for event registration revenue and balances due. We will also need a query to track donations made to a your special event designation. Last, but not least, if you are had any auction item sales associated with your event, we will to build a query of all auction items sold.
To create an OData table, once the query is saved, click Get OData Link to generate the link you will be using in Excel.
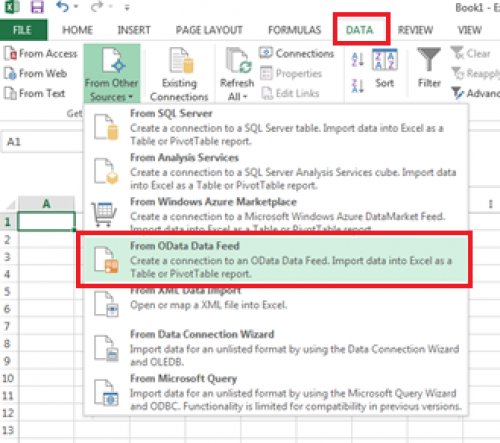
We can then copy this link, and open a new workbook in Excel. Once you are in Excel go to the Data Tab > Select From Other Sources and Select OData Feed.
In the Data Connection Wizard, paste the OData link from Altru into Step 1 and type your Altru Credentials into Step 2 > Click Next.
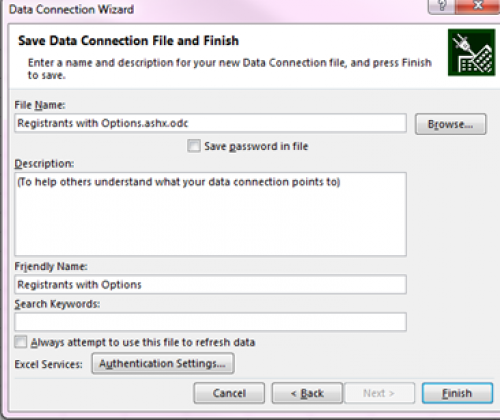
On the final screen in the Data Connection Wizard, you can rename your file or assign a friend name and click Finish.
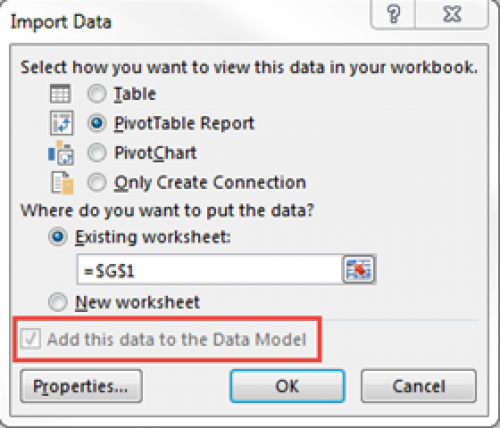
In the Import Data Screen, choose what you would like Altru to do with this data. Make sure the box to Add this Data to the Data Model is marked and click OK.
To successfully connect all of your queries to this feed, repeat the steps above to generate the link for each query and create a connection with this link in Excel.
In order to create the Report we saw in the screenshot above, we will want to create a Power View report dashboard. On the Insert Tab of Excel, Click Power View.
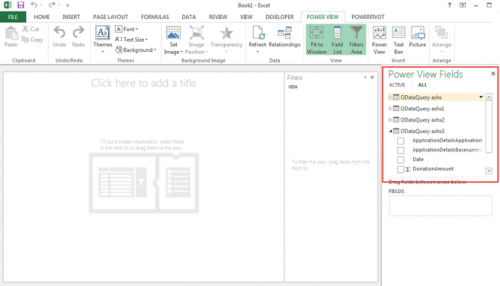
Once Excel has created the Power View Report, you'll see your OData Queries and fields in the report.
Step 3: Add Calculated Fields in Excel
Below, is a list of the calculated fields we will create and the excel formula for each.
Now that we have configured our connections and calculated columns, we can combine these elements to create a customized dashboard for your organization. Below are a few suggestions.
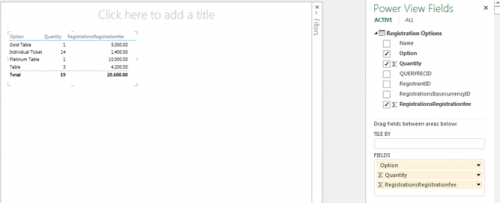
To see Registration Options Sold, on the right side of the screen, we will drag the following fields into a single table in the Power View:
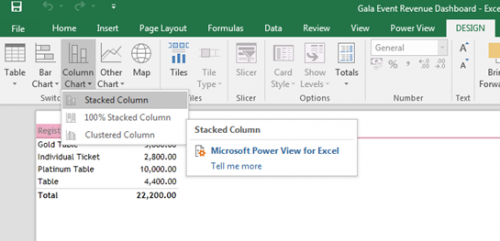
To view a Registration Option Chart, on the right side of the screen we will drag the following fields to a single table in the Power View:
To view Total Raised in a chart, on the right side of the screen, we will drag the following fields to a single table view:
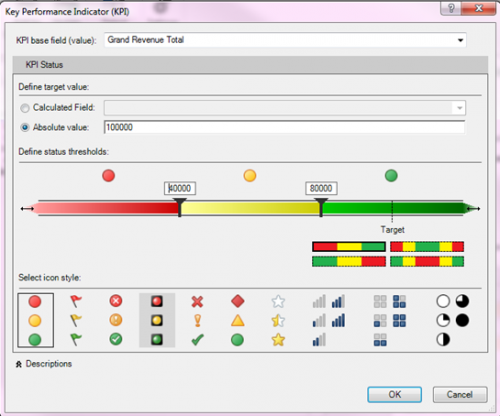
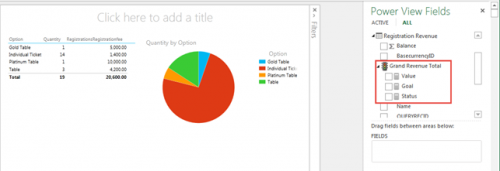
Lastly, you may want to create a Key Performance Indicator (KPI) for Total Revenue in order to track how your organization is doing compared to your goals. You can then drag these fields into the Power View Report as desired.
On the Power View tab, we can spend some time focusing on the visual aspect of the report including: Step 5: Refresh your Feed
Once the dashboard has been customized, save your worksheet in a location that you can access again. The advantage to building an OData Report like this one is that you can quickly and easily update your data with the latest statistics as data is added to your Altru Database. To refresh your Excel Report, navigate to the Power View Tab, click Refresh and select Refresh All. You may be prompted to reenter your password for each query that has been connected to the dashboard.
If you have specific questions about the creation of this OData dashboard, per the Altru Scope of Support, Altru Support Analysts can assist with questions concerning the creation of queries, generating OData links, and ensuring a successful OData connection. Altru Analysts do not assist with the creation of tables, relationships, calculated fields, graphs, or other charts in Microsoft Excel or Tableau. If you are interested in step-by-step instructions or a walk-through of creating this dashboard, you will want to consider purchasing an Altru Assist Package or Consulting Hours for Custom Reporting.
While you're dusting off your event reporting, you may be wondering how to account for donations, auction items, and registrations all in one report. While Altru does not have a canned report to show you all of these items at once, we can build a customized OData Dashboard to help you keep track of your event fundraising progress. Not only will OData help to track all of this revenue in one place, it also allows you to create an end report that is easy for your Executive Team and Board Members to view and digest without overwhelming them with multiple queries. Check out the example below!
While building this dashboard may seem overwhelming, we can easily break this process down into a few easy steps:
- Create your Queries in Altru
- Retrieve the OData links from Altru and Connect them to Excel
- Add a few key Calculated Fields in Excel
- Customize the theme of your Dashboard and add any pictures
- Refresh your OData Connection in Excel to retrieve the most up to date data
Before we can get started with building our reporting using OData, we will first need to create 4 queries in Altru. The first query, will be a list of registrants with registration options. Next, we will want to create a query for event registration revenue and balances due. We will also need a query to track donations made to a your special event designation. Last, but not least, if you are had any auction item sales associated with your event, we will to build a query of all auction items sold.
Note: If you are not currently tracking Auction Items in Altru, we have the following Knowledgebase Solution that discusses how you may choose to track these in Altru. The steps to build the query above reflect how to construct the query based on this recommendation.
In order to make manipulating our data easier in query, we do suggest you rename a few fields you are outputting in the Results fields to display section of each query. To rename a field in the output of your query, you will simply click the line you are looking to rename and then click the pencil icon to edit the name of the field. The Knowledgebase Solutions linked above all include a screenshot of the fields we recommend renaming in the final step.
Step 2: Retrieve the OData links from Altru and Connect them to Excel%u200Bl
If you've never worked in OData before, we will first need to ensure your OData feed has been configured in your database. You will only need to configure this root URL once and it will be universal for all users in Altru. Once this has been configured our next step will be to generate the OData link for each of the queries we built in Altru and connect these links in Excel.
Tip: Before creating a link to OData, make sure the name of the query is final and that the query is in the correct location -- have you placed the query in the correct folder? If the query is renamed or moved to a different folder in your Information Library, the OData link will need to be recreated.
We can then copy this link, and open a new workbook in Excel. Once you are in Excel go to the Data Tab > Select From Other Sources and Select OData Feed.
In the Data Connection Wizard, paste the OData link from Altru into Step 1 and type your Altru Credentials into Step 2 > Click Next.
Note: These steps may vary depending on the version of Excel you are working in. If you are working in excel 2010 or 2013, you can reference the steps above or the steps here. If you are working Excel's Power Query, you can reference these steps to connect your OData link.
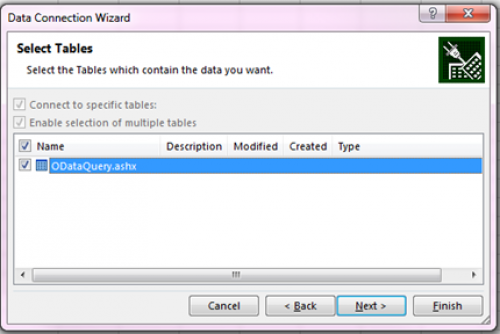
You will then mark the box next to the OData Query and Click Next.
On the final screen in the Data Connection Wizard, you can rename your file or assign a friend name and click Finish.
In the Import Data Screen, choose what you would like Altru to do with this data. Make sure the box to Add this Data to the Data Model is marked and click OK.
Note: You can either mark the option to 'PivotTable Report', this will insert your query data in a table form, or you can choose 'Only Create Connection'.
To successfully connect all of your queries to this feed, repeat the steps above to generate the link for each query and create a connection with this link in Excel.
In order to create the Report we saw in the screenshot above, we will want to create a Power View report dashboard. On the Insert Tab of Excel, Click Power View.
Note: If you don't see this option in Excel, you may need to Enable Power View or Customize your Toolbar to see this option.
Once Excel has created the Power View Report, you'll see your OData Queries and fields in the report.
Tip: If you'd like to rename "ODataQuery.ashx" and "OdataQuery.ashx1," you can do so in the Power Pivot Window.
1. Click the PowerPivot Tab. Click Manage
1. Click the PowerPivot Tab. Click Manage
2. In this window, you'll see your raw data. You can double click the tabs at the bottom of this window to change the names from ODataQuery to something that better represents your queries.
Step 3: Add Calculated Fields in Excel
Now that we have our queries configured, we will now create calculated fields to represent the Total Raised for the different categories. The calculated fields will help us to create more complex calculations and a KPI if needed.
Note: To read more about creating calculated fields in Excel, refer to Microsoft Excel's Resource.
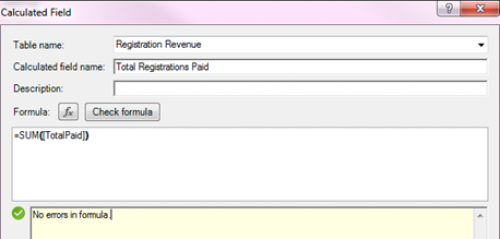
Below, is a list of the calculated fields we will create and the excel formula for each.
- Total Registrations Paid: =SUM([TotalPaid])
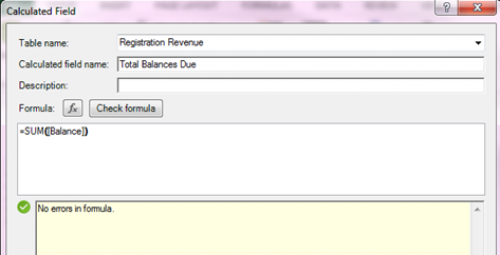
- Total Balances Due: =SUM([Balance])
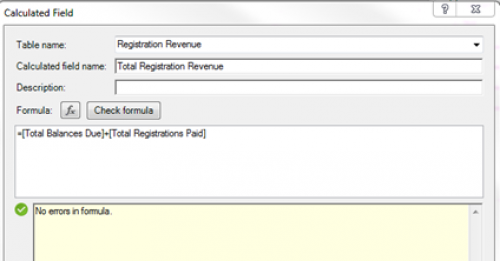
- Total Registration Revenue: =[Total Balances Due] [Total Registrations Paid]
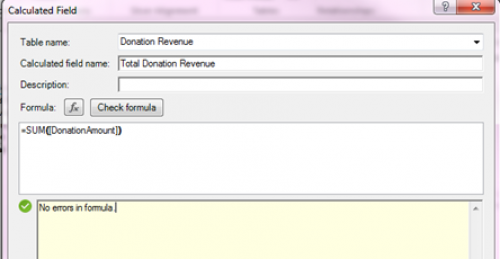
- Total Donation Revenue: =SUM([Amount])
- Total Auction Purchase Revenue: =SUM([Amount])
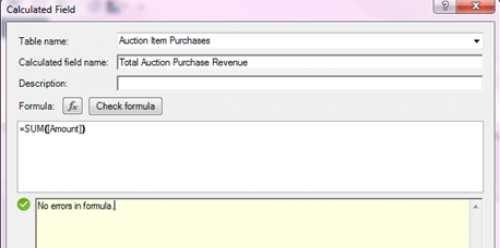
- Grand Revenue Total: =[Total Auction Purchase Revenue] [Total Donation Revenue] [Total Registration Revenue]
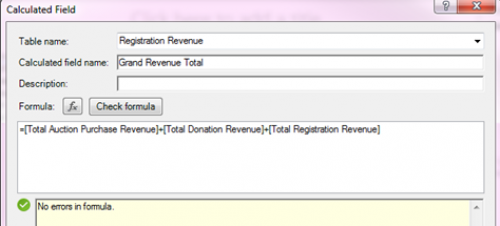
Now that we have configured our connections and calculated columns, we can combine these elements to create a customized dashboard for your organization. Below are a few suggestions.
Note: To read more about creating Power View Reports in Excel, refer to Microsoft Excel's Resource.
To see Registration Options Sold, on the right side of the screen, we will drag the following fields into a single table in the Power View:
- Registration Option
- Quantity and/or Total Registration Amount
To view Total Raised in a chart, on the right side of the screen, we will drag the following fields to a single table view:
- Total Donation Amount
- Total Auction Items
- Total Registration Amount
Lastly, you may want to create a Key Performance Indicator (KPI) for Total Revenue in order to track how your organization is doing compared to your goals. You can then drag these fields into the Power View Report as desired.
On the Power View tab, we can spend some time focusing on the visual aspect of the report including: Step 5: Refresh your Feed
Once the dashboard has been customized, save your worksheet in a location that you can access again. The advantage to building an OData Report like this one is that you can quickly and easily update your data with the latest statistics as data is added to your Altru Database. To refresh your Excel Report, navigate to the Power View Tab, click Refresh and select Refresh All. You may be prompted to reenter your password for each query that has been connected to the dashboard.
Note: The previous username will be saved, but you can change the username if another user is accessing the dashboard. Keep in mind, if the user cannot see the query in Altru, they will not be able to see it in the ODashboard either.
If you have specific questions about the creation of this OData dashboard, per the Altru Scope of Support, Altru Support Analysts can assist with questions concerning the creation of queries, generating OData links, and ensuring a successful OData connection. Altru Analysts do not assist with the creation of tables, relationships, calculated fields, graphs, or other charts in Microsoft Excel or Tableau. If you are interested in step-by-step instructions or a walk-through of creating this dashboard, you will want to consider purchasing an Altru Assist Package or Consulting Hours for Custom Reporting.
News
ARCHIVED | Blackbaud Altru® Tips and Tricks
03/14/2018 12:22pm EDT









Leave a Comment