Power BI Data (LYBUNTs, SYBUNTs, New Donors..)


Is there anyone who has tried to extract information such as LYBUNTs, SYBUNTs, new donors, recovered donors, etc., using a Power BI report? I want dynamic data on a dashboard that includes information like that, but I am not sure how to get that to work. Any articles or discussion posts would be helpful for me to review.
Comments
-
@Hannah White tagging in All-Stars @Dan Snyder and @Alex Wong to see if they have any resources that can help!
2 -
@Hannah White This should be something you can do as long as you are able to get the historical giving information connected to your constituents. Whether you add that directly to the database as something like an attribute/custom field or what is likely a better option would be to get the data you need and then as part of the data transformations in Power BI you can label those LYBUNTS/SYBUNTS to be able to report on them. @Alex Wong may have a more specific example to share.
EDIT: One more link to add -
1 -
@Hannah White
you can try some of these template and see if they meet your need (I don't remember what they all have).https://community.blackbaud.com/forums/viewtopic/586/64602
https://community.blackbaud.com/forums/viewtopic/586/63989
https://community.blackbaud.com/forums/viewtopic/426/69945if you want to learn more about re nxt and power bi and excel in it, @Erik Leaver does host regional workshop specifically for this, which you can check to see if there's one upcoming in your area.
1 -
@Hannah White
https://community.blackbaud.com/forums/viewtopic/586/70826This template allows you to run Query API (running a query from RE and get its result) and pass that result into Power BI directly for visualization.
This method will allow you to do what you want without needing extensive gift history record loaded into Power BI by utilizing the calcuation in Constituent Summary of Gift field.
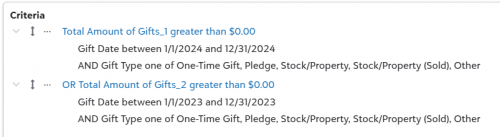
RE Query in webview Criteria of contribution giving in 2023 or 2024 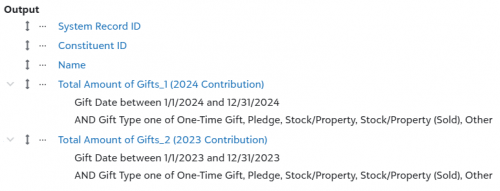
output of IDs, name, 2023 and 2024 contribution giving 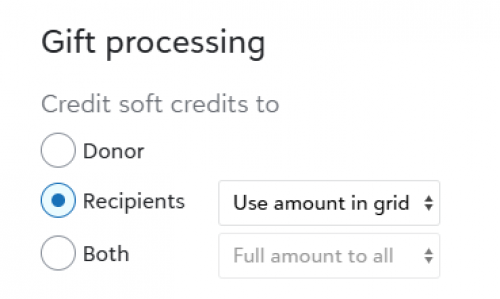
Using gift soft credit by grid amount (this depends on your org recording of soft credit) 
this will give you the query JSON to run adhoc query used in template {
"advanced_processing_options": {},
"category_id": 173,
"constituent_filters": {
"include_deceased": true,
"include_inactive": true,
"include_no_valid_addresses": true
},
"filter_fields": [
{
"compare_type": "None",
"filter_values": [
"$0.00"
],
"operator": "GreaterThan",
"query_field_id": 71937,
"summary_instance": 1
},
{
"compare_type": "Or",
"filter_values": [
"$0.00"
],
"operator": "GreaterThan",
"query_field_id": 71937,
"summary_instance": 2
}
],
"summary_fields": [
{
"summary_instance": 1,
"query_field_id": 71937,
"filter_fields": [
{
"compare_type": "None",
"filter_values": [
"1/1/2024",
"12/31/2024"
],
"operator": "Between",
"query_field_id": 536
},
{
"compare_type": "And",
"filter_values": ["1","8","9","10","18"],
"operator": "OneOf",
"query_field_id": 639
}
]
},
{
"summary_instance": 2,
"query_field_id": 71937,
"filter_fields": [
{
"compare_type": "None",
"filter_values": [
"1/1/2023",
"12/31/2023"
],
"operator": "Between",
"query_field_id": 536
},
{
"compare_type": "And",
"filter_values": ["1","8","9","10","18"],
"operator": "OneOf",
"query_field_id": 639
}
]
}
],
"format": "Dynamic",
"gift_processing_options": {
"matching_gift_credit_option": "MatchingGiftCompany",
"soft_credit_option": "Recipients",
"soft_credit_sub_option": "UseAmountInGrid"
},
"others_can_execute": true,
"others_can_modify": true,
"select_fields": [
{
"query_field_id": 349
},
{
"query_field_id": 425
},
{
"query_field_id": 597
},
{
"query_field_id": 71937,
"user_alias": "2024 Contribution",
"summary_instance": 1
},
{
"query_field_id": 71937,
"user_alias": "2023 Contribution",
"summary_instance": 2
}
],
"sort_fields": [],
"type_id": 18
}Now imagine you got 2022,2023,2024,2025 giving columns, and a column for giving before 2022
In power bi you can easily do LYBUNT with 2024 giving>0 and 2025 giving=0
SYBUNT with (2022 giving>0 or 2023 giving>0 or 2024 giving>0) AND 2025 giving=0
0 -
@Hannah White We have an upcoming in-person training on Power BI in Boston on March 6. Would love to have you join!
https://blackbaud.swoogo.com/microsoftworkshop_boston
1 -
This is very helpful! Thank you so much!!
0 -
Thank you for the resources! I appreciate it?
0 -
Thank you!! I will put this info to good use!
0


Categories
- All Categories
- 6 Blackbaud Community Help
- 209 bbcon®
- 1.4K Blackbaud Altru®
- 394 Blackbaud Award Management™ and Blackbaud Stewardship Management™
- 1.1K Blackbaud CRM™ and Blackbaud Internet Solutions™
- 15 donorCentrics®
- 359 Blackbaud eTapestry®
- 2.5K Blackbaud Financial Edge NXT®
- 646 Blackbaud Grantmaking™
- 563 Blackbaud Education Management Solutions for Higher Education
- 3.2K Blackbaud Education Management Solutions for K-12 Schools
- 934 Blackbaud Luminate Online® and Blackbaud TeamRaiser®
- 84 JustGiving® from Blackbaud®
- 6.4K Blackbaud Raiser's Edge NXT®
- 3.7K SKY Developer
- 243 ResearchPoint™
- 118 Blackbaud Tuition Management™
- 165 Organizational Best Practices
- 238 The Tap (Just for Fun)
- 33 Blackbaud Community Challenges
- 28 PowerUp Challenges
- 3 (Open) Raiser's Edge NXT PowerUp Challenge: Product Update Briefing
- 3 (Closed) Raiser's Edge NXT PowerUp Challenge: Standard Reports+
- 3 (Closed) Raiser's Edge NXT PowerUp Challenge: Email Marketing
- 3 (Closed) Raiser's Edge NXT PowerUp Challenge: Gift Management
- 4 (Closed) Raiser's Edge NXT PowerUp Challenge: Event Management
- 3 (Closed) Raiser's Edge NXT PowerUp Challenge: Home Page
- 4 (Closed) Raiser's Edge NXT PowerUp Challenge: Standard Reports
- 4 (Closed) Raiser's Edge NXT PowerUp Challenge: Query
- 779 Community News
- 2.9K Jobs Board
- 53 Blackbaud SKY® Reporting Announcements
- 47 Blackbaud CRM Higher Ed Product Advisory Group (HE PAG)
- 19 Blackbaud CRM Product Advisory Group (BBCRM PAG)