Dashboard Builder/Insight Designer resources, tips or tricks?


Good evening!
I am really getting to know the Insight Designer Dashboards this week. Every time I build a new insight, I will then run a SKY list in EM, Academics or Core to make sure that my numbers match. Often times they do not, so I have been doing a lot of trial and error in an attempt to figure out what the insight designer is including/excluding within each object. I haven't been able to find anything that I can reference that discloses these specifics.
Today, I built an insight to include active candidates with an entering year of 2023-2024. I went back to EMS to run a SKY list with what I assumed to be the same filter options applied, but my numbers were not matching. I discovered that the Dashboard "Candidates" metric only pulls back candidates that have a "Candidate status". If you go to Enrollment Management > Admissions > Candidates List, you might have 500 records. If you expand the filter Candidate Information > Select current status > Select All > Apply filter, your results will likely decrease. From what I am gathering, candidates without a status are being excluded from the Dashboard analytics.
I'm also trying to grasp the following insight:
Inquiries by Quarter vs. Previous Year. Is it better to define the start/end dates since I assume Q1 = January 1st-March 31st.
This post was helpful for the "This Year" measure, but I'm still unclear on the definition of quarters:
Dec 2nd 2020 - Recent and upcoming improvements
I also found a few other posts from Janet to be very informative:
When can you drill in on an Insight?
How do I validate insight results? AKA "too many data points to display"
Use of filters and saving insights for reuse
I think the insight dashboards can be very powerful! I am in need of more transparency on exactly how the data is being presented so that I can speak to it if questioned and also feel confident in knowing that it's accurate. Does anyone have any tips, tricks or documentation you've been gathering while exploring Dashboards? Please feel free to message me if you wouldn't mind sharing! I will be documenting my findings and am happy to share those out once I feel as though I have a better grasp on it all!
Comments
-
@Kristen Duval - I hear exactly what you are saying. At my previous position, we purchased Insight Designer very quickly in the hopes of using its potential power to gain some academic insights. One of my first major projects was doing a deep dive into grade distributions. Imagine how shocked I was when the numbers the Insight Designer gave me were different than the numbers the Grading Reports: Grade Distribution gave me. Both were looking at the exact same data, but after hours of combing through the data, I figured out that Insight Designer was not counting grades issued in a course that was later dropped. I was told that Insight Designer “was functioning as designed.” I was baffled as to why a hard-wired system report would function one way while the new cutting-edge analysis tool functioned differently with the same data. After that experience, I did not trust the numbers I was seeing via the Insight Designer Dashboard. I was also dismayed by the lack of academic data points available in the module. I felt it really limited the module's potential in this area. My current school has chosen not to purchase the module to date, so I have not worked with the module in 2 years and do not know if it has improved, but from your post, it sounds as if some of the same issues exist. Unrealized potential…
Scott
2 -
@Kristen Duval I have also experienced inaccurate data. Support hasn't been able to help much either.
1 -
@Kristen Duval Thank you for offering to get all of this together!
I've been keeping a general list of what I'm finding in the Dashboards to begin with so that the admins I eventually share it with will have some context.
I'm still struggling with the Insight Designer and plan to wait until we're deeper into the enrollment season so that I have more data points to validate.So far, I have-
General: There will be a time delay- at times when numbers vary from day to day, this is important to keep in mind
Reporting
* Includes returning students who haven’t yet re-enrolled
* Will include fake or test students, so mentally discount those (we try to mark them with some kind of outlier designation, like a gender that isn't otherwise being used.Admissions Overview
* Funnel counts candidates who enrolled and then withdrew as being enrolled?My overall goal is to create an Insight that compares Status of active applicants by grade to prior years, all on one chart. So for instance, “As of December 1st for the last 10 years, we had this many Inquiries for second grade.”
If anyone knows how I can generate something like that I'd be ecstatic.
2 -
@Ash Smelkinson
There are a couple ways to exclude your test students:- When using the “student” metrics, you can add the attribute filter “name." Then search for your test students and uncheck them.
- You can also add a “name” filter to the top, search for your test students and uncheck them.
This has helped me so much since the SKY lists don't allow to exclude individuals.
3 -
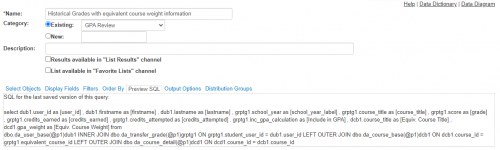
Oh wow! That is great information to know. Thank you for sharing! I am starting with Candidates, but I am hoping to familiarize myself with the grading analytics next. You just saved me probably a few hours of troubleshooting! Advanced lists have a preview SQL tab. In the least, I believe that if the backend code used in the Dashboards were exposed, it would make my life a whole lot easier! Less of a mystery!
 0
0 -
I am making this a project of mine the next month or so. I will be sure to share anything I learn with you! I'm compiling my list now!
1 -
@Ash Smelkinson
Beautiful! Thank you so much for sharing! Feel free to pass along anything else you might uncover in the meantime! I am hoping to make note of all my findings, but it might take some time. I will be sure to share this knowledge with you! Thanks again!0 -
@Kristen Duval The advanced lists and Insight Designer function on different platforms, to the best of my knowledge- the Insight Designer functions on the SKY platform, whereas advanced lists are on Podium (the legacy platform for Education Management that will eventually (NOT imminently) be phased out). I don't know if SKY also utilizes SQL.
0 -
@Kristen Duval please and thank you! I am particularly interested in what you discover re Grading Analytics!
0 -
@Kristen Duval
Hi Kristen. I created a dashboard that displays the annual monthly application count by grade level. The below insight is created for each year and inserted on the same dashboard.1 -
@Kathleen Sanders
Any chance you can reshare this? I get a 404 error when I click it0


Categories
- All Categories
- 6 Blackbaud Community Help
- 211 bbcon®
- 1.4K Blackbaud Altru®
- 402 Blackbaud Award Management™ and Blackbaud Stewardship Management™
- 1.1K Blackbaud CRM™ and Blackbaud Internet Solutions™
- 15 donorCentrics®
- 360 Blackbaud eTapestry®
- 2.6K Blackbaud Financial Edge NXT®
- 656 Blackbaud Grantmaking™
- 577 Blackbaud Education Management Solutions for Higher Education
- 3.2K Blackbaud Education Management Solutions for K-12 Schools
- 941 Blackbaud Luminate Online® and Blackbaud TeamRaiser®
- 84 JustGiving® from Blackbaud®
- 6.7K Blackbaud Raiser's Edge NXT®
- 3.7K SKY Developer
- 248 ResearchPoint™
- 120 Blackbaud Tuition Management™
- 165 Organizational Best Practices
- 240 Member Lounge (Just for Fun)
- 34 Blackbaud Community Challenges
- 37 PowerUp Challenges
- 3 (Open) PowerUp Challenge: Grid View Batch
- 3 (Closed) PowerUp Challenge: Chat for Blackbaud AI
- 3 (Closed) PowerUp Challenge: Data Health
- 3 (Closed) Raiser's Edge NXT PowerUp Challenge: Product Update Briefing
- 3 (Closed) Raiser's Edge NXT PowerUp Challenge: Standard Reports+
- 3 (Closed) Raiser's Edge NXT PowerUp Challenge: Email Marketing
- 3 (Closed) Raiser's Edge NXT PowerUp Challenge: Gift Management
- 4 (Closed) Raiser's Edge NXT PowerUp Challenge: Event Management
- 3 (Closed) Raiser's Edge NXT PowerUp Challenge: Home Page
- 4 (Closed) Raiser's Edge NXT PowerUp Challenge: Standard Reports
- 4 (Closed) Raiser's Edge NXT PowerUp Challenge: Query
- 796 Community News
- 3K Jobs Board
- 54 Blackbaud SKY® Reporting Announcements
- 47 Blackbaud CRM Higher Ed Product Advisory Group (HE PAG)
- 19 Blackbaud CRM Product Advisory Group (BBCRM PAG)