Sharing my Power BI template: Year-to-Date Slicer


Sometimes users require greater control to fine-tune the through-date of a year over year comparable period.
This template contains examples:
- Use a slicer to choose to view year-over-year comparisons of similar periods with data through the latest refresh date OR as of the end-of a selected month.
- Compare Gauge and Bullet Chart visuals
- Use TOTALYTD() to compare running results by month across years
- Use Tooltip Page to visualize details
- Grab this M-Query code for DimDate, if you need a date table.
Suggested Skill Level: Beginner/Intermediate
Configuration Details:
The sample data is from Sky Developer Cohort RENXT, accessed via Power BI Connector. Data is embedded so that you can explore, even if you do not have the connector set up for yourself. If you do have the Power BI Connector, then refresh the data and authenticate to your organization's RENXT environment.
Screen shots:


Comments
-
@Rebecca Sundquist
Thank you for this.Below is my observation, if anyone disagree, I would love to hear the counter argument.
I think a lot of time I read from many post and/or YouTube video, where they talk about an “Ultimate Date Table”, I don't think I agree with it, as you probably have seen in many of my Power BI, my Date Table is usually very slim.
I have been creating Date Table in DAX rather than M Query (which shouldn't matter much, M Query makes for creating Date Table more “copy/pasting” so it is easier) and only have been creating field (column) for what I need in the reporting. For many of my year to year (we do calendar year), I only have few columns (Year and if i'm doing donor retention, I will have a boolean column for IfFirstYear which I will have the whole BI report filter out first year in filter). I like to keep my tables “slim” and not have extranous columns when I don't need them in the reporting. When I do YearToDate reporting, I will have extra column for DayInYear. I will add Quarter if I needed to report on it, same with Month, etc.
1 -
@Alex Wong, thanks for adding to the conversation! It's good for our community to know that a Date table can be created with DAX and it should be as simple as possible to support the report. My M Query might have some fluff and is missing the year off-set that @Larry Callan mentioned in our user group today.
Personally, I have a pet peeve against DayInYear because March 1 has a different value in leap years, making it harder to select March from the slicer and sum data through the end of March in both Leap Years and Standard Years. Leap Year pushed me to pave my own way with a Fiscal MMDD field in my date table, even before I adopted Power BI. If I wasn't also trying to calculate data up to the refresh date, then simply using Fiscal Month Number ≤ Selected Fiscal Month would have worked.
1 -
@Rebecca Sundquist
yup, I totally get the need for more date table info esp when it's not calendar year based. and your “pet peeve” about leap year. My org is less concern over the 1 day differences esp on a month-end of Feb, they are more into quarters for now, so the 1 day diff didn't bother them.As for the offset Larry mentioned, I will try our using offset year to see if it will help with the dynamic column name. I would love to hear from Larry too on his use case for offset column, and compare to my own way of doing things and see pro/con of it.
2 -
@Rebecca Sundquist Hello! This is such an awesome resource, thank you!! I've been using your template in conjunction with a dashboard I created a while back. My goal is to build an updated dashboard (including a FYTD slicer) that sums constituents' total giving by FY and buckets them into the appropriate giving level for each fiscal year. The end result would be able to show total giving and the number of donors within each giving band FYTD year-over-year. Where I'm getting stuck is what measures are needed to line up all the moving pieces. Below are the two measures I've come up with, but they are not giving me results. Is it a quick fix? Or am I treading in too deep waters too soon?
")
Measure 1:
Total Received by Donor = CALCULATE(
sum(Gifts[Fund Split Amount]),
Filter (
Gifts,
Gifts[Constituent ID]
)
)
Measure 2 (referencing measure 1):
Giving Level =
SWITCH(
True(),
[Total Received by Donor] > 9999999.99, "$1M+",
[Total Received by Donor] > 499999.99, "$500,000-$999,999",
[Total Received by Donor] > 99999.99, "$100,000-$499,999",
[Total Received by Donor] > 49999.99, "$50,000-$99,999",
[Total Received by Donor] > 24999.99, "$25,000-$49,999",
[Total Received by Donor] > 9999.99, "$10,000-$24,999",
[Total Received by Donor] > 4999.99, "$5,000-$9,999",
[Total Received by Donor] > 999.99, "$1,000-$4,999",
[Total Received by Donor] > 99.99, "$100-$499",
[Total Received by Donor] > 0, "Less than $100"
)
0 -
Hi, @Becky Griswold! You've raised a common question. There are a couple ways to address Giving Level: Measures or Calculated Table/Columns.
Measures
@Alex Wong demonstrated using Measures: Aug 2023 Power BI User Group - Blackbaud Community (40min mark)
@Hallie Guiseppe demonstrated using Measures for a similar concept (Retained/Recaptured/Acquired): Jul 2024 Power BI User Group - Blackbaud Community (28 mins)
What you'll find different about their measures compared to your attempt is that they are not trying to apply a specific level to each account. Instead, they are aggregating results for constituents who qualify in one level and then calculating additional measures for each additional level. This can also be accomplished with Calculation Groups, which give more a dimensional behavior to your collection of giving level measures and save time by coding the business rule (constituent filter by value) only one time per level instead of creating a copy of every measure for every level.
Your attempt to assign one giving level to each constituent is failing because measures are aggregations. Calculated columns assign values.
Calculated Table
I have published a template using a Calculated Table: Sharing my Power BI DAX for Annual Lifecycle and Giving Level Analysis - Blackbaud Community
I like the calculated table because it facilitates drill-through to the donors tagged with a specific giving level. It also lets me look at giving level in the reported year compared to prior year for upgrade/downgrade trends. You'll find a SWITCH() statement in this example because we are assigning levels to individual constituents.
1 -
@Rebecca Sundquist - Thanks so much for further direction. I really appreciate your help!
1 -
@Becky Griswold
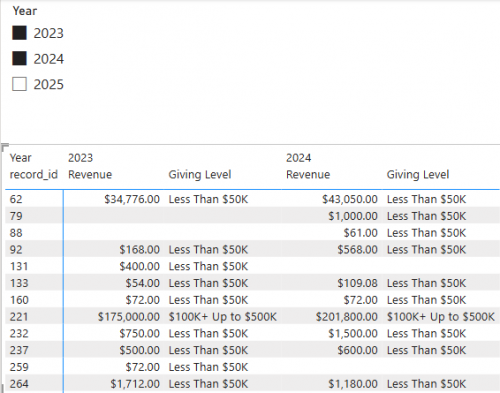
it is important that you map the relationship of the tables properly, for example, if you did the link from constituent table to gift table by the constituent id, then your “Total Received by Donor” will only need to be (using a shorter name Revenue) Revenue = SUM(Gifts[Fund Split Amount]). The measure will take care of itself when it is in context of “per constituent”.Then for the Giving Level:
Giving Level = SWITCH(TRUE(), [Revenue]>=1000000, "$1M+", [Revenue]>=500000, "$500K+ Up to $1M", [Revenue]>=100000, "$100K+ Up to $500K", [Revenue]>=50000, "$50K+ Up to $100K", [Revenue]>0, "Less Than $50K")this is measure, so the “level” is “calculated” dynamically according to the context of the BI at that moment in time, meaning, if you selected filter for date for FY24, it will give you level for FY24, if you filter on FY23, it will be level for FY23. However, if you filter on FY23 and FY24, then the level will be based on giving in both FY.
you can use “Matrix” visualization to see “across FY”
 3
3 -
@Alex Wong Thank you SO much! This makes a lot of sense. I'll give it a whirl.
0 -
Does the zip/folder still exist? When I click on the link it does not work.
0 -
@Dylan Grafius I see what you mean. Likely an issue from the migration to the new platform. Tagging @Crystal Bruce to help restore the file.
1 -
Sorry all - on the old platform it still returns a error 404 link. I'll see if Rebecca still has the file!
0 -
@Dylan Grafius, I have re-uploaded the .zip file. Thanks for notifying us!
0


Categories
- All Categories
- 6 Blackbaud Community Help
- 211 bbcon®
- 1.4K Blackbaud Altru®
- 403 Blackbaud Award Management™ and Blackbaud Stewardship Management™
- 1.2K Blackbaud CRM™ and Blackbaud Internet Solutions™
- 15 donorCentrics®
- 360 Blackbaud eTapestry®
- 2.6K Blackbaud Financial Edge NXT®
- 659 Blackbaud Grantmaking™
- 579 Blackbaud Education Management Solutions for Higher Education
- 3.2K Blackbaud Education Management Solutions for K-12 Schools
- 943 Blackbaud Luminate Online® and Blackbaud TeamRaiser®
- 84 JustGiving® from Blackbaud®
- 6.7K Blackbaud Raiser's Edge NXT®
- 3.8K SKY Developer
- 250 ResearchPoint™
- 120 Blackbaud Tuition Management™
- 165 Organizational Best Practices
- 241 Member Lounge (Just for Fun)
- 36 Blackbaud Community Challenges
- 37 PowerUp Challenges
- 3 (Open) PowerUp Challenge: Grid View Batch
- 3 (Closed) PowerUp Challenge: Chat for Blackbaud AI
- 3 (Closed) PowerUp Challenge: Data Health
- 3 (Closed) Raiser's Edge NXT PowerUp Challenge: Product Update Briefing
- 3 (Closed) Raiser's Edge NXT PowerUp Challenge: Standard Reports+
- 3 (Closed) Raiser's Edge NXT PowerUp Challenge: Email Marketing
- 3 (Closed) Raiser's Edge NXT PowerUp Challenge: Gift Management
- 4 (Closed) Raiser's Edge NXT PowerUp Challenge: Event Management
- 3 (Closed) Raiser's Edge NXT PowerUp Challenge: Home Page
- 4 (Closed) Raiser's Edge NXT PowerUp Challenge: Standard Reports
- 4 (Closed) Raiser's Edge NXT PowerUp Challenge: Query
- 798 Community News
- 3K Jobs Board
- 56 Blackbaud SKY® Reporting Announcements
- 47 Blackbaud CRM Higher Ed Product Advisory Group (HE PAG)
- 19 Blackbaud CRM Product Advisory Group (BBCRM PAG)