Any Insight Designer here?


I am trying out the trial for Insight Designer and sort of getting the hang of it. I have three questions:
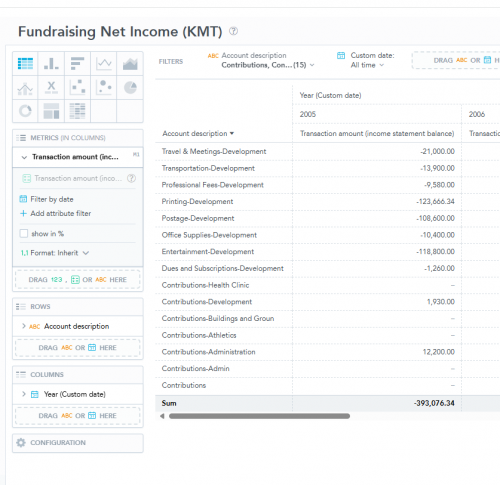
1) in setting up chart of data, I have the account category in the column to split out revenue and expense, but it is putting in alphabetical order to the expense is first and then the revenue. How do it get it to show the revenue first and then the expense.
2) I also have budgets in the column and I would like to show multiple scenarios. First the final budget and then the projected budget. But I can't seem to use two budget columns to show in the chart.
3) I want a total of the row at the end to be the net result of revenue less expenses. For the actuals I figured out to use the amount that has the expense a negative so it ‘rolls up’ correctly, But the budget column does not have negative expense, so the roll up is adding the rev and exp.
Any thoughts?
Comments
-
@Sylvia Cook hey sylvia! Here's my answers:
1 - Should be able to sort the individual columns -- it will by default go to alphabetical order (based on type).
2 - Can select ALL or one. If you need more than one budget to review, need to create another tile on same dashboard for comparison
3 - Check the image below for the formula element to add
Please let me know if you have any other questions!
0 -
@Blake Paradise
Hi Blake, Can you explain to me more about the formula element? Is this what you are referring too? I was hoping to find something that would allow me to say subtract column X from column Y. This just seems to add them up. My problem is specifically with the budget scenario column in that the expense accounts are not negatives so it is adding the revenue and expense, not netting them.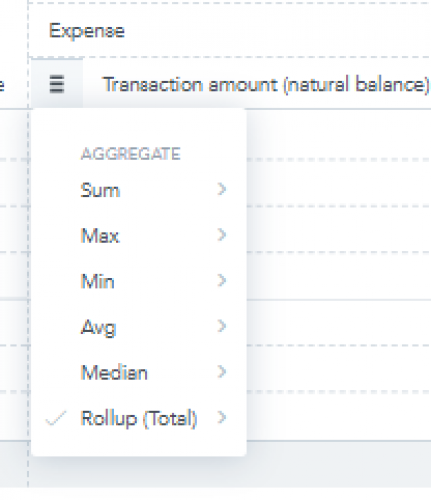 0
0


Categories
- All Categories
- 6 Blackbaud Community Help
- 211 bbcon®
- 1.4K Blackbaud Altru®
- 403 Blackbaud Award Management™ and Blackbaud Stewardship Management™
- 1.2K Blackbaud CRM™ and Blackbaud Internet Solutions™
- 15 donorCentrics®
- 360 Blackbaud eTapestry®
- 2.6K Blackbaud Financial Edge NXT®
- 658 Blackbaud Grantmaking™
- 579 Blackbaud Education Management Solutions for Higher Education
- 3.2K Blackbaud Education Management Solutions for K-12 Schools
- 943 Blackbaud Luminate Online® and Blackbaud TeamRaiser®
- 84 JustGiving® from Blackbaud®
- 6.7K Blackbaud Raiser's Edge NXT®
- 3.8K SKY Developer
- 250 ResearchPoint™
- 120 Blackbaud Tuition Management™
- 165 Organizational Best Practices
- 241 Member Lounge (Just for Fun)
- 36 Blackbaud Community Challenges
- 37 PowerUp Challenges
- 3 (Open) PowerUp Challenge: Grid View Batch
- 3 (Closed) PowerUp Challenge: Chat for Blackbaud AI
- 3 (Closed) PowerUp Challenge: Data Health
- 3 (Closed) Raiser's Edge NXT PowerUp Challenge: Product Update Briefing
- 3 (Closed) Raiser's Edge NXT PowerUp Challenge: Standard Reports+
- 3 (Closed) Raiser's Edge NXT PowerUp Challenge: Email Marketing
- 3 (Closed) Raiser's Edge NXT PowerUp Challenge: Gift Management
- 4 (Closed) Raiser's Edge NXT PowerUp Challenge: Event Management
- 3 (Closed) Raiser's Edge NXT PowerUp Challenge: Home Page
- 4 (Closed) Raiser's Edge NXT PowerUp Challenge: Standard Reports
- 4 (Closed) Raiser's Edge NXT PowerUp Challenge: Query
- 798 Community News
- 3K Jobs Board
- 56 Blackbaud SKY® Reporting Announcements
- 47 Blackbaud CRM Higher Ed Product Advisory Group (HE PAG)
- 19 Blackbaud CRM Product Advisory Group (BBCRM PAG)