? Your input requested: Grade detail graph


Hi all,
Ben from Blackbaud here. We're looking for your input on the See grade detail graph from the Progress tab for students:
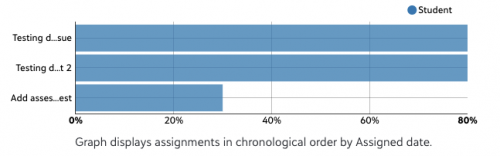
What's helpful about the graph? What's not? How would you change or replace it?
Thank you!
Ben
Comments
-
Grade graph helps give a VISUAL on assignments that the student didn't do well on - our students are show this graph and encouraged to use as a point to talk with their teachers - anything under th 80% mark they should be in discussion with their teacher.
1 -
For us, the Grade detail graph can be misleading to students/parents IF they don't have a clear understanding of our school's assessment policy. I think both students and parents get attached to the graph - vs. looking below the graph at the actual grades and comments.
We have 2 main assessment categories - Formative and Summative. Formative assignments do NOT count towards the student's final grade - only Summative assignments do. Formative assignments are the checkpoints along the way - do students understand the content? Are there areas of concern that need to be addressed NOW before the Summative assignment(s) come around?
[Prior to the 7/20/2021 major update, Formative assignments also had a max points of 0, so NO bar would show...but this year, you have to put in some point value...but that's another post by itself...]
With the Grade detail graph showing scores for both categories in assigned date chronological order, and not differentiating between these 2 categories, it can be misleading to students/parents who see a blue bar for Formative assignments.
My wishlist for the grade detail graph:- Schools having the ability to turn OFF the graph.
- The graph being able to display more information - differentiating between assignment categories (color coding).
- OR! If we could NOT display a particular category - that would be AWESOME!
1 -
We should have the ability to not show assignments on the graph if their grade is non-numeric. In Leslie's example, the formative assignments (those that have no scores and are just graded as Approaching Expectations, Meets Expectations, and Exceeds Expectations) should not show on a numeric graph. The “grade” is not numeric and there is no percentage of achievement. The graph is very misleading. The graph is useful for assignments/assessments that do receive a numeric grade. This is why it should be optional by assignment type. OR just allow us to enter a 0 like how it was before.
1 -
I have a suggestion for this screen, but it has to do with the information displayed below the graph. Our lower school shows individual assignment grades, but not cumulative averages. We can turn off cumulative averages in the settings by division/by teacher. Unfortunately, there is no way to hide the Assignment Type cumulative averages that display below the graph for parents/students. While this is helpful information for our older MS and US students, we don't want to show it to our youngest LMS users who do not see other cumulative averages. If there was a way to show/hide Assignment type cumulative averages per division and/or per teacher, that would be super helpful.
1 -
We are actually having an issue with some teachers grades being different in progress vs. detail.
0 -
Teachers at my school liked the charts as they were accessible from the gradebook and then they went away. Can the chart choice from before be returned to the gradebook?
0 -
Michael Moulton We'd actually LOVE to connect with some of the teachers at your school on this topic if they're game. We want to know what was most helpful about the chart, what they'd like to see moving forward, etc. If that seems of interest, feel free to connect: ben.leddy@blackbaud.com.0
-
Same. We are too. I logged this as Blackbaud Support Case 018543484.
0 -
At the risk of repeating, my teachers liked it the way it was and wish the choice to be returned to the gradebook.
0


Categories
- All Categories
- 6 Blackbaud Community Help
- 211 bbcon®
- 1.4K Blackbaud Altru®
- 403 Blackbaud Award Management™ and Blackbaud Stewardship Management™
- 1.2K Blackbaud CRM™ and Blackbaud Internet Solutions™
- 15 donorCentrics®
- 360 Blackbaud eTapestry®
- 2.6K Blackbaud Financial Edge NXT®
- 660 Blackbaud Grantmaking™
- 581 Blackbaud Education Management Solutions for Higher Education
- 3.2K Blackbaud Education Management Solutions for K-12 Schools
- 944 Blackbaud Luminate Online® and Blackbaud TeamRaiser®
- 84 JustGiving® from Blackbaud®
- 6.7K Blackbaud Raiser's Edge NXT®
- 3.8K SKY Developer
- 250 ResearchPoint™
- 120 Blackbaud Tuition Management™
- 165 Organizational Best Practices
- 242 Member Lounge (Just for Fun)
- 37 Blackbaud Community Challenges
- 37 PowerUp Challenges
- 3 (Closed) PowerUp Challenge: Grid View Batch
- 3 (Closed) PowerUp Challenge: Chat for Blackbaud AI
- 3 (Closed) PowerUp Challenge: Data Health
- 3 (Closed) Raiser's Edge NXT PowerUp Challenge: Product Update Briefing
- 3 (Closed) Raiser's Edge NXT PowerUp Challenge: Standard Reports+
- 3 (Closed) Raiser's Edge NXT PowerUp Challenge: Email Marketing
- 3 (Closed) Raiser's Edge NXT PowerUp Challenge: Gift Management
- 4 (Closed) Raiser's Edge NXT PowerUp Challenge: Event Management
- 3 (Closed) Raiser's Edge NXT PowerUp Challenge: Home Page
- 4 (Closed) Raiser's Edge NXT PowerUp Challenge: Standard Reports
- 4 (Closed) Raiser's Edge NXT PowerUp Challenge: Query
- 800 Community News
- 3K Jobs Board
- 56 Blackbaud SKY® Reporting Announcements
- 47 Blackbaud CRM Higher Ed Product Advisory Group (HE PAG)
- 19 Blackbaud CRM Product Advisory Group (BBCRM PAG)