Analytics In Raiser’s Edge NXT: Basic Queries With Affluence Insight™

Shelley Weifenbach
Blackbaud Employee


Affluence Insight™ helps fundraisers to prioritize their prospect research and fundraising efforts by estimating a donor's wealth and using donor personas to target their communications more strategically. In this post, you will learn 5 top tips and tricks for using Affluence Insight ratings to group and report on using Raiser's Edge® or Blackbaud Raiser’s Edge NXT® Query.
Note: This post was updated to incorporate the Raiser's Edge®-ResearchPoint™ integration enhancements releasing in Q2 2023.TO QUERY OR NOT TO QUERY
Reporting on Ratings has its benefits and challenges in Lists, Query, and Export, which I summarize in the “Best Reporting Tool” blog post. The Query tool may be your database administrator’s go to tool, but before you head into the database view, start by determining if web view Lists will meet your grouping and reporting needs. With its succinct display of specific Ratings columns and easy filtering, web view Lists is one of the best ways to report on Ratings in Blackbaud Raiser’s Edge NXT! Learn more about these tips and tricks in the “Basics of Lists with Affluence Insight” blog post.
Tip: If your Affluence Insight Wealth Attributes criteria does not have the proper operator to use in List filters, it is because the rating is formatted as a text data type. To fix these ratings, consider re-syncing your Affluence Insight ratings from ResearchPoint to Raiser's Edge after the May 2023 integration enhancements to append new ratings with updated naming conventions and correct data types.
If Lists either doesn’t have the right columns available to display or you need more robust criteria, then it is time to head to Query!
BENEFITS & CHALLENGES
Criteria
Query is a robust grouping tool to use practically any Raiser’s Edge field in the criteria. The sky is the limit as the criteria you can include! You can also create complex criteria with AND statements, OR statements, and parentheses, where we may be more limited in Lists. Also unlike Lists, a query’s criteria options are not limited by the Rating’s data type. This can be especially helpful when querying on Affluence Insight Wealth Attributes that are formatted as text fields.
Output
Let me remind you that Query is a grouping tool and is not intended as a reporting tool, however when it comes to reporting on Ratings, we may be able to stretch the functionality beyond its purpose.
In Lists and Query, you can choose to display a specific Rating in the output. For example, you may want to see each of the Affluence Insight scores in their own, unique column for easy sorting and filtering in Raiser’s Edge NXT or a spreadsheet. Let me caution you about your query output. If you add one-to-many fields (e.g. constituency codes), then your results may display duplicate constituents, causing you more manual clean up in Excel. Make sure to keep your output to one-to-one fields (e.g. first name, primary constituency code, etc.) as much as possible.
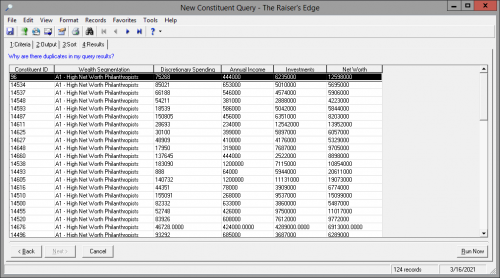
After you sync your ratings from ResearchPoint after May 2023, you will not need to rely on Query for your ratings output to download into a spreadsheet because Export will give you control to extract specific ratings with the new naming conventions. We will cover more on this subject in the "Basics of Export with Affluence Insight" blog post.
TOP 5 TIPS YOU NEED TO KNOW
Tip #1: Static vs. Dynamic Query Format
In normal circumstances, I always recommend starting with a dynamic query. Depending on your goal or purpose, you may decide to create a static query to start a new web view List with this group of records. Remember you can always start your query as dynamic and save as a static query later.
Tip #2: Finding Ratings
Finding where the Ratings fields are in Query criteria or output can be challenging, but once you know where to look, it gets much easier!
Start by reviewing a constituent record’s Ratings tile or tab. Look for the rating(s) you want to include in your query. Make a note of the Rating Source (e.g. "Blackbaud Analytics - WP" or "Blackbaud - Wealth Segmentation") and Rating Category (e.g. "Target Analytics Wealth Segmentation" or "Wealth Segmentation") combinations. If you have similar ratings from a different year, for instance Target Analytics Income from 2020 and 2021, then also make a note of the most recent Rating Date to include in the criteria.
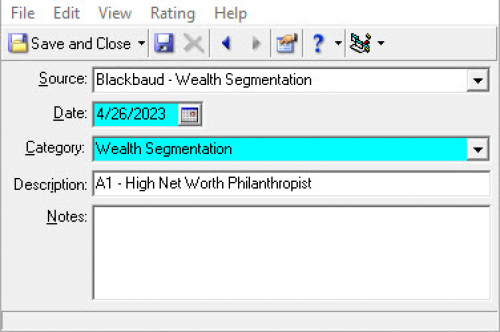
Note: As a best practice, Blackbaud recommends only keeping the most recent Affluence Insight ratings in Raiser’s Edge. This will also make grouping and analyzing your ratings much easier!
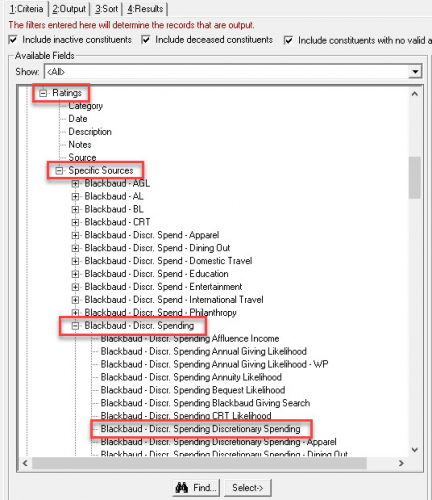
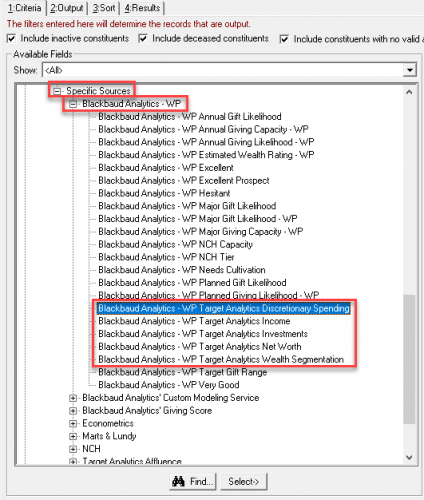
Now create a new Constituent query. To add the Rating to the criteria and/or output tabs, navigate to Prospect (if you have the RE:Search module) > Ratings > Specific Sources > [choose the Source name] > [choose the Specific Source and Rating Category combination].
Here is an example of querying after May 2023:
Here is an example of querying prior to May 2023:
Tip #3: Adding Criteria
Once you navigate to the specific Rating (see Tip #2) on the criteria tab, double-click on the field. You will be prompted for the operator and value next.
Wealth Attributes
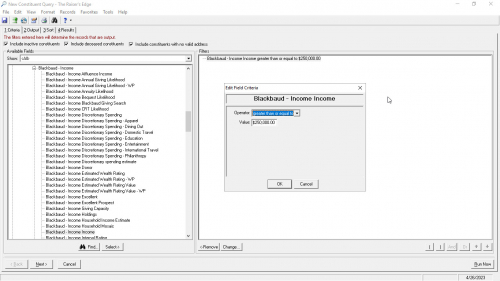
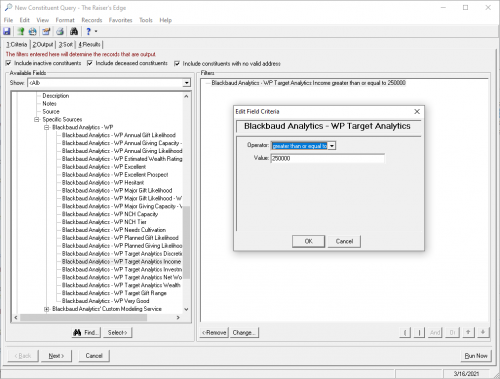
If you add one of the wealth attribute ratings—Income, Discretionary Spending, Investments, Net Worth—then you will most likely use the operators “greater than or equal to,” “greater than,” or “between”. Here are examples of querying on these ratings:
Wealth Segmentation
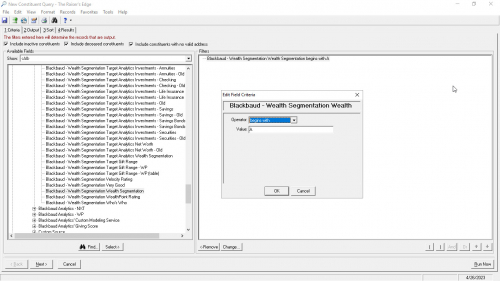
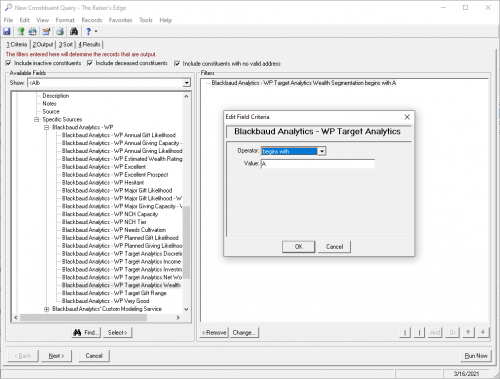
This criteria window will vary based on how the Wealth Segmentation rating is configured in your database. If the Rating is configured as a text field, typically with with the Ratings Source of "Blackbaud - Wealth Segmentation" or "Blackbaud Analytics - WP", you can use the “equals”, “starts with”, or “one of” operators.
If the Wealth Segmentation rating is configured as a table when you imported your Affluence Insight scores, common with the Ratings Source of "Target Analytics Affluence", you will be able to select from a table of options.
Tip #4: Display Ratings In Output/Results
Add any Rating to your results by navigating to the Output tab and follow the same process as on the Criteria tab: Prospect (if you have the RE:Search module) > Ratings > Specific Sources > [choose the Source name] > [choose the Specific Source and Rating name combination].
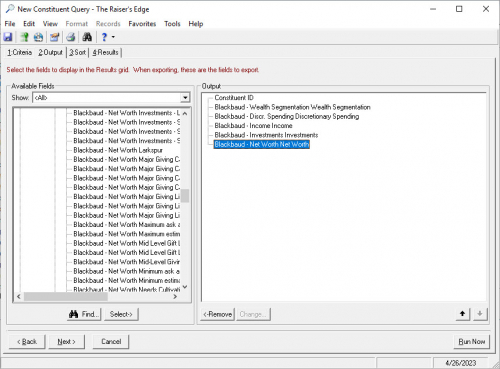
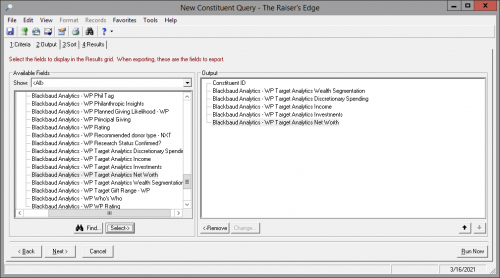
This is a situation where you may be able export the query results into a spreadsheet directly from Query. The catch is that you can only display one-to-one fields (i.e. where there can only be one value in the field) not one-to-many fields (e.g. all of their constituent codes) or your results may display duplicates. The reliance on query output to extract ratings into a spreadsheet will be minimized after syncing these ratings from ResearchPoint after May 2023, at which point you will be able to more easily export ratings with the new naming conventions.
Tip #5: Customize Column Headers
I saved my favorite tip for last! You may be aware that you can customize column headers in Export, but did you know you can in Query too?! My mind was blown the first time I saw this!
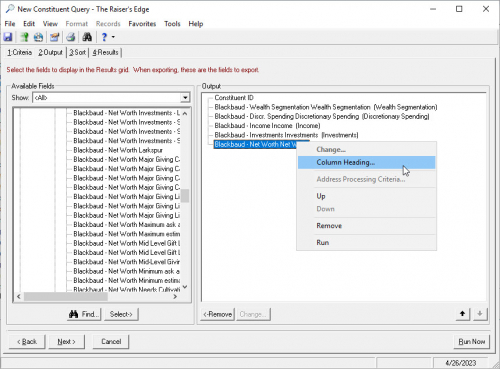
On the Output tab, right-click on the Rating Category name and choose “Column Heading…”. Type in a clear and concise column header so you (and your colleagues) have a nice header when you view the results of the query or download it into a spreadsheet.
Put It Together
In the example below, you can see the finished query output using these 5 tips:
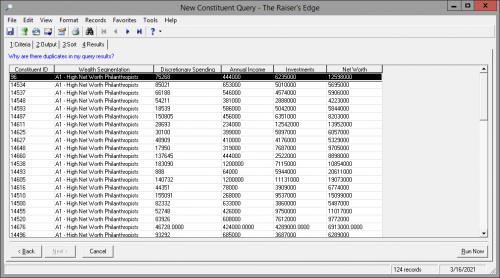
Now you can save as a static query to use in web view Lists, download the results into a spreadsheet (File > Export), use it in a Report or Export, or save it for another day!
SAMPLE QUERIES
Here are some examples of common queries to create in your database or at least give you an idea for where to start:
For even more complex queries, consider adding some of the following fields into the criteria:
Using Query to group by and/or analyze your constituents’ Affluence Insight models is a great choice when you need complex criteria. If you ratings continue to have the same Source, consider using Query to also extract select ratings into a spreadsheet when required.
If Query still does not quite meet your output or reporting needs, such as you would like to include one-to-many fields in the results, then you should try Export next. I recommend using a query with an export parameter file to extract Affluence Insight ratings if you synced your models from ResearchPoint after May 2023.
Comment below if you have additional questions or tips to share with the Community!
WHAT’S NEXT?
The next blog post in the series, "Basics of Export with Affluence Insight", I will share additional tips and tricks for reporting on Affluence Insight ratings using Export.
Check out the “The Best Reporting Tool” blog post to understand the benefits and challenges of reporting on analytics using Lists, Query, and Export tools, plus links to the full "Analytics in Raiser's Edge NXT" series! You may also benefit from the “Getting Started with Affluence Insight” post to learn more about how your Affluence Insight scores are configured and display in Raiser’s Edge NXT.
Not sure if you have the Affluence Insight subscription? Check out this blog post on how to confirm!
Note: This post was updated to incorporate the Raiser's Edge®-ResearchPoint™ integration enhancements releasing in Q2 2023.TO QUERY OR NOT TO QUERY
Reporting on Ratings has its benefits and challenges in Lists, Query, and Export, which I summarize in the “Best Reporting Tool” blog post. The Query tool may be your database administrator’s go to tool, but before you head into the database view, start by determining if web view Lists will meet your grouping and reporting needs. With its succinct display of specific Ratings columns and easy filtering, web view Lists is one of the best ways to report on Ratings in Blackbaud Raiser’s Edge NXT! Learn more about these tips and tricks in the “Basics of Lists with Affluence Insight” blog post.
Tip: If your Affluence Insight Wealth Attributes criteria does not have the proper operator to use in List filters, it is because the rating is formatted as a text data type. To fix these ratings, consider re-syncing your Affluence Insight ratings from ResearchPoint to Raiser's Edge after the May 2023 integration enhancements to append new ratings with updated naming conventions and correct data types.
If Lists either doesn’t have the right columns available to display or you need more robust criteria, then it is time to head to Query!
BENEFITS & CHALLENGES
Criteria
Query is a robust grouping tool to use practically any Raiser’s Edge field in the criteria. The sky is the limit as the criteria you can include! You can also create complex criteria with AND statements, OR statements, and parentheses, where we may be more limited in Lists. Also unlike Lists, a query’s criteria options are not limited by the Rating’s data type. This can be especially helpful when querying on Affluence Insight Wealth Attributes that are formatted as text fields.
Output
Let me remind you that Query is a grouping tool and is not intended as a reporting tool, however when it comes to reporting on Ratings, we may be able to stretch the functionality beyond its purpose.
In Lists and Query, you can choose to display a specific Rating in the output. For example, you may want to see each of the Affluence Insight scores in their own, unique column for easy sorting and filtering in Raiser’s Edge NXT or a spreadsheet. Let me caution you about your query output. If you add one-to-many fields (e.g. constituency codes), then your results may display duplicate constituents, causing you more manual clean up in Excel. Make sure to keep your output to one-to-one fields (e.g. first name, primary constituency code, etc.) as much as possible.

After you sync your ratings from ResearchPoint after May 2023, you will not need to rely on Query for your ratings output to download into a spreadsheet because Export will give you control to extract specific ratings with the new naming conventions. We will cover more on this subject in the "Basics of Export with Affluence Insight" blog post.
TOP 5 TIPS YOU NEED TO KNOW
Tip #1: Static vs. Dynamic Query Format
In normal circumstances, I always recommend starting with a dynamic query. Depending on your goal or purpose, you may decide to create a static query to start a new web view List with this group of records. Remember you can always start your query as dynamic and save as a static query later.
Tip #2: Finding Ratings
Finding where the Ratings fields are in Query criteria or output can be challenging, but once you know where to look, it gets much easier!
Start by reviewing a constituent record’s Ratings tile or tab. Look for the rating(s) you want to include in your query. Make a note of the Rating Source (e.g. "Blackbaud Analytics - WP" or "Blackbaud - Wealth Segmentation") and Rating Category (e.g. "Target Analytics Wealth Segmentation" or "Wealth Segmentation") combinations. If you have similar ratings from a different year, for instance Target Analytics Income from 2020 and 2021, then also make a note of the most recent Rating Date to include in the criteria.

Note: As a best practice, Blackbaud recommends only keeping the most recent Affluence Insight ratings in Raiser’s Edge. This will also make grouping and analyzing your ratings much easier!
Now create a new Constituent query. To add the Rating to the criteria and/or output tabs, navigate to Prospect (if you have the RE:Search module) > Ratings > Specific Sources > [choose the Source name] > [choose the Specific Source and Rating Category combination].
Here is an example of querying after May 2023:

Here is an example of querying prior to May 2023:

Tip #3: Adding Criteria
Once you navigate to the specific Rating (see Tip #2) on the criteria tab, double-click on the field. You will be prompted for the operator and value next.
Wealth Attributes
If you add one of the wealth attribute ratings—Income, Discretionary Spending, Investments, Net Worth—then you will most likely use the operators “greater than or equal to,” “greater than,” or “between”. Here are examples of querying on these ratings:


Wealth Segmentation
This criteria window will vary based on how the Wealth Segmentation rating is configured in your database. If the Rating is configured as a text field, typically with with the Ratings Source of "Blackbaud - Wealth Segmentation" or "Blackbaud Analytics - WP", you can use the “equals”, “starts with”, or “one of” operators.


If the Wealth Segmentation rating is configured as a table when you imported your Affluence Insight scores, common with the Ratings Source of "Target Analytics Affluence", you will be able to select from a table of options.
Tip #4: Display Ratings In Output/Results
Add any Rating to your results by navigating to the Output tab and follow the same process as on the Criteria tab: Prospect (if you have the RE:Search module) > Ratings > Specific Sources > [choose the Source name] > [choose the Specific Source and Rating name combination].


This is a situation where you may be able export the query results into a spreadsheet directly from Query. The catch is that you can only display one-to-one fields (i.e. where there can only be one value in the field) not one-to-many fields (e.g. all of their constituent codes) or your results may display duplicates. The reliance on query output to extract ratings into a spreadsheet will be minimized after syncing these ratings from ResearchPoint after May 2023, at which point you will be able to more easily export ratings with the new naming conventions.
Tip #5: Customize Column Headers
I saved my favorite tip for last! You may be aware that you can customize column headers in Export, but did you know you can in Query too?! My mind was blown the first time I saw this!
On the Output tab, right-click on the Rating Category name and choose “Column Heading…”. Type in a clear and concise column header so you (and your colleagues) have a nice header when you view the results of the query or download it into a spreadsheet.

Put It Together
In the example below, you can see the finished query output using these 5 tips:

Now you can save as a static query to use in web view Lists, download the results into a spreadsheet (File > Export), use it in a Report or Export, or save it for another day!
SAMPLE QUERIES
Here are some examples of common queries to create in your database or at least give you an idea for where to start:
| Name |
|---|
| Affluence Insight – ‘A’ Donor Category: Philanthropists |
| Affluence Insight – ‘B’ Donor Category: Humanitarians |
| Affluence Insight – ‘C’ Donor Category: Casual Donors |
| Affluence Insight – ‘D’ Donor Category: Affluent Enigmas |
| Affluence Insight – ‘E’ Donor Category: Nonaffluent Enigmas |
| High Est. Income |
| High Est. Investments |
| High Est. Net Worth |
| High Est. Discretionary Spending |
For even more complex queries, consider adding some of the following fields into the criteria:
- Assigned Solicitor (assigned vs. not assigned)
- Latest/Greatest Gift Details (compared to their Target Gift Range)
- Total Giving (compared to their Target Gift Range)
- Proposal Status or Classification
- ProspectPoint Predictive Models
Using Query to group by and/or analyze your constituents’ Affluence Insight models is a great choice when you need complex criteria. If you ratings continue to have the same Source, consider using Query to also extract select ratings into a spreadsheet when required.
If Query still does not quite meet your output or reporting needs, such as you would like to include one-to-many fields in the results, then you should try Export next. I recommend using a query with an export parameter file to extract Affluence Insight ratings if you synced your models from ResearchPoint after May 2023.
Comment below if you have additional questions or tips to share with the Community!
WHAT’S NEXT?
The next blog post in the series, "Basics of Export with Affluence Insight", I will share additional tips and tricks for reporting on Affluence Insight ratings using Export.
Check out the “The Best Reporting Tool” blog post to understand the benefits and challenges of reporting on analytics using Lists, Query, and Export tools, plus links to the full "Analytics in Raiser's Edge NXT" series! You may also benefit from the “Getting Started with Affluence Insight” post to learn more about how your Affluence Insight scores are configured and display in Raiser’s Edge NXT.
Not sure if you have the Affluence Insight subscription? Check out this blog post on how to confirm!
1
Comments
-
Great information
0
Categories
- All Categories
- 6 Blackbaud Community Help
- 211 bbcon®
- 1.4K Blackbaud Altru®
- 398 Blackbaud Award Management™ and Blackbaud Stewardship Management™
- 1.1K Blackbaud CRM™ and Blackbaud Internet Solutions™
- 15 donorCentrics®
- 360 Blackbaud eTapestry®
- 2.5K Blackbaud Financial Edge NXT®
- 651 Blackbaud Grantmaking™
- 570 Blackbaud Education Management Solutions for Higher Education
- 3.2K Blackbaud Education Management Solutions for K-12 Schools
- 939 Blackbaud Luminate Online® and Blackbaud TeamRaiser®
- 84 JustGiving® from Blackbaud®
- 6.6K Blackbaud Raiser's Edge NXT®
- 3.7K SKY Developer
- 248 ResearchPoint™
- 119 Blackbaud Tuition Management™
- 165 Organizational Best Practices
- 240 The Tap (Just for Fun)
- 34 Blackbaud Community Challenges
- 31 PowerUp Challenges
- 3 (Open) PowerUp Challenge: Data Health
- 3 (Closed) Raiser's Edge NXT PowerUp Challenge: Product Update Briefing
- 3 (Closed) Raiser's Edge NXT PowerUp Challenge: Standard Reports+
- 3 (Closed) Raiser's Edge NXT PowerUp Challenge: Email Marketing
- 3 (Closed) Raiser's Edge NXT PowerUp Challenge: Gift Management
- 4 (Closed) Raiser's Edge NXT PowerUp Challenge: Event Management
- 3 (Closed) Raiser's Edge NXT PowerUp Challenge: Home Page
- 4 (Closed) Raiser's Edge NXT PowerUp Challenge: Standard Reports
- 4 (Closed) Raiser's Edge NXT PowerUp Challenge: Query
- 788 Community News
- 2.9K Jobs Board
- 53 Blackbaud SKY® Reporting Announcements
- 47 Blackbaud CRM Higher Ed Product Advisory Group (HE PAG)
- 19 Blackbaud CRM Product Advisory Group (BBCRM PAG)


